Add more power to Prometheus
A while ago
I published this article: https://www.suse.com/c/discover-the-hidden-treasure/ . Today, I would like to share my most recent experiences with you. This post will show you the value collectd can provide for your Prometheus-based observability solution. Let me give you a brief introduction of collectd. Collectd is a daemon that reads various system statistics, e.g. the operating system, applications, logfiles, and external devices. It stores this information or makes it available over the network. Statistics are very fine-grained. This information can be used to monitor systems, find performance bottlenecks and predict future system load.
The power of Collectd Plugins
In the former blog post, I was using the prometheus-node_exporter textfile.collector to extend the metrics data with hardware information. I couldn’t get the disk information directly from an exporter because the disks are “hidden” behind a Raid-Controller. All physical properties including S.M.A.R.T. data are not visible. Today I will show you another option to get additional information transferred into a metric and process them with Prometheus, Grafana, and the Prometheus alert manager.
For collectd we provide many plugins to collect data. To store or export data I like to focus on the Prometheus export method. To make this happen the collectd.conf must look like this:
# view /etc/collectd.conf
...
LoadPlugin write_prometheus
...
<Plugin write_prometheus>
 Port "9103"
</Plugin>
...
The “exec” Plugin
I would like to show you two scripts that demonstrate how you can transfer additional information into a metric. The first example shows how to check if there is a reboot pending and the second one demonstrates checking the HANA logsegment file flags (Free, RetainedFree, Truncated, …)
Knowing is better than thinking
Imagine the following scenario, security patches that require a reboot are rolled out to your servers. A reboot is triggered remotely, but one or more of your systems doesn’t do the reboot. On these system the newly applied patches are not yet active!
There are multiple ways to check this e.g.:
- looking for the uptime,
- verify if the expected version of a package is running,
- or checking if the “needs-restarting” flag is set for this host
The tool needs-restarting list running processes that might still use files and libraries deleted or updated by recent upgrades. The following script is used to collect the information and handover to collectd.
# cat /opt/needs-reboot.sh

#!/bin/bash
HOSTNAME="${COLLECTD_HOSTNAME:-`hostname -f`}"
INTERVAL="${COLLECTD_INTERVAL:-60}"

while sleep "$INTERVAL"; do
      RB=$(needs-restarting -r 2>&1 >/dev/null; echo $?)
        echo "PUTVAL \"$HOSTNAME/exec-needs-restart/gauge-reboot_required\" interval=$INTERVAL N:$RB"
done
# vi /etc/collectd.conf
...
LoadPlugin exec
LoadPlugin write_prometheus
...
<Plugin exec>
     Exec "collectd:users" "/opt/needs-reboot.sh"
</Plugin>
...
<Plugin write_prometheus>
Port "9103"
</Plugin>
...
As collectd is not authorized to run scripts a root, we must create a new user who can execute the script.
# useradd -m -g users -s /bin/bash -r collectd
# /etc/systemd/system/collectd.service
[Unit]
Description=Collectd statistics daemon
Documentation=man:collectd(1) man:collectd.conf(5)
After=local-fs.target network-online.target
Requires=local-fs.target network-online.target

[Service]
ExecStart=/usr/sbin/collectd
EnvironmentFile=-/etc/sysconfig/collectd
EnvironmentFile=-/etc/default/collectd

# A few plugins won't work without some privileges, which you'll have to specify using the CapabilityBoundingSet directive below.
#
# Here's a (incomplete) list of the plugins known capability requirements:
#   ceph            CAP_DAC_OVERRIDE
#   dns             CAP_NET_RAW
#   exec            CAP_SETUID CAP_SETGID
#   intel_rdt       CAP_SYS_RAWIO
#   intel_pmu       CAP_SYS_ADMIN
#   iptables        CAP_NET_ADMIN
#   ping            CAP_NET_RAW
#   processes       CAP_NET_ADMIN  (CollectDelayAccounting only)
#   smart           CAP_SYS_RAWIO
#   turbostat       CAP_SYS_RAWIO
# By default, drop all capabilities:
CapabilityBoundingSet=CAP_SETUID CAP_SETGID
# systemctl daemon-reload
# systemctl restart collectd.service
or
# systemctl enable --now collectd.service
# curl http://localhost:9103/metrics/ |grep exec
  % Total    % Received % Xferd  Average Speed   Time    Time     Time  Current
                                 Dload  Upload   Total   Spent    Left  Speed
100 60053  100 60053    0     0  28.6M      0# HELP collectd_exec_gauge write_prometheus plugin: 'exec' Type: 'gauge', Dstype: 'gauge', Dsname: 'value'
 # TYPE collectd_exec_gauge gauge
--collectd_exec_gauge{exec="needs-restart",type="reboot_required",instance="ls3331"} 0 1683782520768
The metric is:
collectd_exec_gauge{exec="needs-restart",type="reboot_required",instance="ls3331"}
A value of 0 means that no reboot is required. In the above example, the first value, a zero, means the a reboot is not required. The second value is a timestamp.
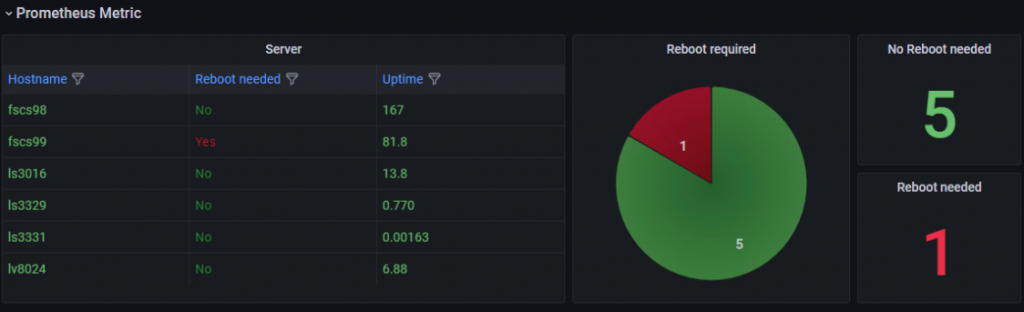
Make it visible
- name: security-patch-monitoring
  rules:
  - alert: reboot-required
    expr: collectd_exec_gauge{type="reboot_required"} == 1
    labels:
    annotations:
      title: Node {{ $labels.instance }} reboot required.
      description: The server {{ $labels.instance }} is marked with the flag reboot-needed. It is mandatory to reboot the host to apply the latest patches.
Build a second line of defense and avoid a disk-full situation
# vi /opt/hanasr-broken.sh
#!/bin/bash
SHOSTNAME="${COLLECTD_HOSTNAME:-`hostname -s`}"
INTERVAL="${COLLECTD_INTERVAL:-60}"
while sleep "$INTERVAL"; do
RB=$(su - ha1adm -c "hdblogdiag seglist /hana/log/HA1/mnt00001/hdb00003.00003/ |grep RetainedFree | wc -l")
    if [ $? -ne 0 ]
    then
    RB="Z"
    fi
    echo "PUTVAL \"$SHOSTNAME/exec-hanasr-broken/gauge-retainedfree\" interval=$INTERVAL N:$RB"
done
Now extend the collectd plugin exec section with the new script:
<Plugin exec>
     Exec "collectd:users" "/opt/needs-reboot.sh"
     Exec "collectd:users" "/opt/hanasr-broken.sh"
</Plugin>
Because the collectd user is performing a user switch, we have to make some additional adjustments.
# vi /etc/systemd/system/collectd.service
...
CapabilityBoundingSet=CAP_SETUID CAP_SETGID
LimitNOFILE=1048576
...
# vi /etc/pam.d/su-l
#%PAM-1.0
auth sufficient pam_rootok.so
auth [success=ignore default=1] pam_succeed_if.so user = ha1adm
auth sufficient pam_succeed_if.so use_uid user = collectd
auth include common-auth
...
- name: hana-sr-log_segment-monitoring
rules:
- alert: log-segment_RetainedFree_flag
expr: avg_over_time(collectd_exec_gauge{type="retainedfree"}[1h]) >= 2
for:
labels:
severity: warning
annotations:
title: HANA SR on node {{ $labels.instance }} seems broken.
description: HANA logsegment files on {{ $labels.instance }} with the flag RetainedFree are increasing. Depending on the value logshipping_max_retention_size (default is 1TB per log volume) your system can run into a disk full situation.
Bernd
Related Articles
Jan 17th, 2025
Why Change? Innovations in SUSE Linux Enterprise Server 16
Jun 14th, 2024
A Comprehensive Guide to Navigating CentOS End of Life
Oct 25th, 2024