Customizing your Application with Epinio

Donnerstag, 26 Mai, 2022

One of the best things about Kubernetes is just how absurdly flexible it is.

You, as an admin, can shape what gets deployed into what is the best for your business. Whether this is a basic webapp with just a deployment, service and ingress; or if you need all sorts of features with sidecars and network policies wrapping the serverless service-mesh platform of the day. The power is there.

This has long been one of the weaknesses of the PaaS style approach since you tend to be locked into what the platform builder’s opinions are at the time.

With some of the features in recent releases of Epinio, we’ve found a middle ground!

You can now give your developers both the ease of use, short learning curve and speed that they want while also getting the ability to shape what applications should look like in your environments!

This takes the shape of two features: custom Application Template(s), and a Service Marketplace. Let’s dive into what these are and how to use them.

Application Templates in Epinio

The way a deployment works with Epinio is that the developer pushes their code to the platform where it’s cached in an object store, built using buildpacks, pushed to a registry, generates a values.yaml, then deployed using helm to the local cluster.

In past releases, all of this was configurable except the deployment itself. You could use your own object storage, buildpacks and registry but were locked into a basic application that was just a deployment, service and ingress.

We’ve introduced a new custom resource in Epinio that allows for a platform admin to set up a list of application templates that can be selected by the application developer for their application!

With this feature, you could offer a few different styles of applications to your developers to choose from while still keeping the developer’s life easier as well as allowing for governance of what gets deployed. For example, you could have a secure chart, a chart with an open-telemetry sidecar, a chart that deploys Akri configurations, a chart that deploys to Knative or whatever you can dream of!

So how do I set up an application template in Epinio?

Good question, I’m glad you asked (big grin)

The first thing you need is a helm chart! (Feel free to copy from our default template found here: https://github.com/epinio/helm-charts/blob/main/chart/application)

Since Epinio generates the values.yaml during the push, your chart will be deployed with values that look similar to:

epinio:
  tlsIssuer: epinio-ca
  appName: placeholder
  replicaCount: 1
  stageID: 999
  imageURL: myregistry.local/apps/epinio-app
  username: user
  routes:
  - domain: epinio-app.local
    id: epinio-app.local
    path: /
  env:
  - name: env-name
    value: env-value
  configurations:
  - config-name
  start: null

Note: The ability for developers to pass in additional values is being added soon: https://github.com/epinio/epinio/issues/1252

Once you have all your customizations done, build it into a tgz file using helm package and host it somewhere accessible from the cluster (potentially in the cluster itself using Epinio?).

With the chart published, you can now expose it to your developers by adding this CRD to the namespace that Epinio is installed in („epinio“ if you followed the docs):

apiVersion: application.epinio.io/v1
kind: AppChart
metadata:
  name: my-custom-chart
  namespace: epinio
spec:
  description: Epinio chart with everything I need
  helmChart: https://example.com/file.tgz
  shortDescription: Custom Application Template with Epinio

With this done, the developer can view what templates can be used using:

epinio app chart list

Then when they push their code, they can pick the chart they want with:

epinio push --name myapp --app-chart my-custom-chart

Service Marketplace in Epinio

The other huge piece of the puzzle is the service marketplace functionality. We went around in circles for a bit on what services to enable or which set of operators to support. Instead, we decided that Helm was a good way to give choice.

Similar to the Application Templates, the Service Marketplace offerings are controlled via CRDs in the epinio namespace so you can easily add your own.

By default, we include charts for Redis, Postgres, MySQL and RabbitMQ for use in developer environments.

To add a helm chart into the marketplace, create a new Epinio Service object that looks like:

apiVersion: application.epinio.io/v1
kind: Service
metadata:
  name: my-new-service
  namespace: epinio
spec:
  appVersion: 0.0.1
  chart: custom-service
  chartVersion: 0.0.1
  description: |
    This is a custom chart to demo services.
  helmRepo:
    name: custom-chart
    url: https://charts.bitnami.com/bitnami
  name: custom-chart
  shortDescription: A custom service 
  values: |-
    exampleValue: {}

Since we are using helm, you can put any Kubernetes object in the marketplace. This is super helpful as it means that we can seamlessly tie into other operator-based solutions (such as Crossplane or KubeDB but I’ll leave that as an exercise for the reader).

We are working toward a 1.0.0 release that includes a better onboarding flow, improved security, bringing the UI to parity with the CLI and improving documentation of common workflows. You can track our progress in the milestone: https://github.com/epinio/epinio/milestone/6

Give Epinio a try at https://epinio.io/

Deploying K3s with Ansible

Montag, 16 Mai, 2022

There are many different ways to run a Kubernetes cluster, from setting everything up manually to using a lightweight distribution like K3s. K3s is a Kubernetes distribution built for IoT and edge computing and is excellent for running on low-powered devices like Raspberry Pis. However, you aren’t limited to running it on low-powered hardware; it can be used for anything from a Homelab up to a Production cluster. Installing and configuring multinode clusters can be tedious, though, which is where Ansible comes in.

Ansible is an IT automation platform that allows you to utilize “playbooks” to manage the state of remote machines. It’s commonly used for managing configurations, deployments, and general automation across fleets of servers.

In this article, you will see how to set up some virtual machines (VMs) and then use Ansible to install and configure a multinode K3s cluster on these VMs.

What exactly is Ansible?

Essentially, Ansible allows you to configure tasks that tell it what the system’s desired state should be; then Ansible will leverage modules that tell it how to shift the system toward that desired state. For example, the following instruction uses the ansible.builtin.file module to tell Ansible that /etc/some_directory should be a directory:

- name: Create a directory if it does not exist
  ansible.builtin.file:
    path: /etc/some_directory
    state: directory
    mode: '0755'

If this is already the system’s state (i.e., the directory exists), this task is skipped. If the system’s state does not match this described state, the module contains logic that allows Ansible to rectify this difference (in this case, by creating the directory).

Another key benefit of Ansible is that it carries out all of these operations via the Secure Shell Protocol (SSH), meaning you don’t need to install agent software on the remote targets. The only special software required is Ansible, running on one central device that manipulates the remote targets. If you wish to learn more about Ansible, the official documentation is quite extensive.

Deploying a K3s cluster with Ansible

Let’s get started with the tutorial! Before we jump in, there are a few prerequisites you’ll need to install or set up:

  • A hypervisor—software used to run VMs. If you do not have a preferred hypervisor, the following are solid choices:
    • Hyper-V is included in some Windows 10 and 11 installations and offers a great user experience.
    • VirtualBox is a good basic cross-platform choice.
    • Proxmox VE is an open source data center-grade virtualization platform.
  • Ansible is an automation platform from Red Hat and the tool you will use to automate the K3s deployment.
  • A text editor of choice
    • VS Code is a good option if you don’t already have a preference.

Deploying node VMs

To truly appreciate the power of Ansible, it is best to see it in action with multiple nodes. You will need to create some virtual machines (VMs) running Ubuntu Server to do this. You can get the Ubuntu Server 20.04 ISO from the official site. If you are unsure which option is best for you, pick option 2 for a manual download.

Download Ubuntu image

You will be able to use this ISO for all of your node VMs. Once the download is complete, provision some VMs using your hypervisor of choice. You will need at least two or three to get the full effect. The primary goal of using multiple VMs is to see how you can deploy different configurations to machines depending on the role you intend for them to fill. To this end, one “primary” node and one or two “replica” nodes will be more than adequate.

If you are not familiar with hypervisors and how to deploy VMs, know that the process varies from tool to tool, but the overall workflow is often quite similar. Below you can find some official resources for the popular hypervisors mentioned above:

In terms of resource allocation for each VM, it will vary depending on the resources you have available on your host machine. Generally, for an exercise like this, the following specifications will be adequate:

  • CPU: one or two cores
  • RAM: 1GB or 2GB
  • HDD: 10GB

This tutorial will show you the VM creation process using VirtualBox since it is free and cross-platform. However, feel free to use whichever hypervisor you are most comfortable with—once the VMs are set up and online, the choice of hypervisor does not matter any further.

After installing VirtualBox, you’ll be presented with a welcome screen. To create a new VM, click New in the top right of the toolbar:

VirtualBox welcome screen

Doing so will open a new window that will prompt you to start the VM creation process by naming your VM. Name the first VM “k3s-primary”, and set its type as Linux and its version as Ubuntu (64-bit). Next, you will be prompted to allocate memory to the VM. Bear in mind that you will need to run two or three VMs, so the amount you can give will largely depend on your host machine’s specifications. If you can afford to allocate 1GB or 2GB of RAM per VM, that will be sufficient.

After you allocate memory, VirtualBox will prompt you to configure the virtual hard disk. You can generally click next and continue through each of these screens, leaving the defaults as they are. You may wish to change the size of the virtual hard disk. A memory of 10GB should be enough—if VirtualBox tries to allocate more than this, you can safely reduce it to 10GB. Once you have navigated through all of these steps and created your VM, select your new VM from the list and click on Settings. Navigate to the Network tab and change the Attached to value to Bridged Adapter. Doing this ensures that your VM will have internet access and be accessible on your local network, which is important for Ansible to work correctly. After changing this setting, click OK to save it.

VM network settings

Once you are back on the main screen, select your VM and click Start. You will be prompted to select a start-up disk. Click on the folder icon next to the Empty selection:

Empty start-up disk

This will take you to the Optical Disk Selector. Click Add, and then navigate to the Ubuntu ISO file you downloaded and select it. Once it is selected, click Choose to confirm it:

Select optical disk

Next, click Start on the start-up disk dialog, and the VM should boot, taking you into the Ubuntu installation process. This process is relatively straightforward, and you can accept the defaults for most things. When you reach the Profile setup screen, make sure you do the following:

  • Give all the servers the same username, such as “ubuntu”, and the same password. This is important to make sure the Ansible playbook runs smoothly later.
  • Make sure that each server has a different name. If more than one machine has the same name, it will cause problems later. Suggested names are as follows:
    • k3s-primary
    • k3s-replica-1
    • k3s-replica-2

Ubuntu profile setup

The next screen is also important. The Ubuntu Server installation process lets you import SSH public keys from a GitHub profile, allowing you to connect via SSH to your newly created VM with your existing SSH key. To take advantage of this, make sure you add an SSH key to GitHub before completing this step. You can find instructions for doing so here. This is highly recommended, as although Ansible can connect to your VMs via SSH using a password, doing so requires extra configuration not covered in this tutorial. It is also generally good to use SSH keys rather than passwords for security reasons.

Ubuntu SSH setup

After this, there are a few more screens, and then the installer will finally download some updates before prompting you to reboot. Once you reboot your VM, it can be considered ready for the next part of the tutorial.

However, note that you now need to repeat these steps one or two more times to create your replica nodes. Repeat the steps above to create these VMs and install Ubuntu Server on them.

Once you have all of your VMs created and set up, you can start automating your K3s installation with Ansible.

Installing K3s with Ansible

The easiest way to get started with K3s and Ansible is with the official playbook created by the K3s.io team. To begin, open your terminal and make a new directory to work in. Next, run the following command to clone the k3s-ansible playbook:

git clone https://github.com/k3s-io/k3s-ansible

This will create a new directory named k3s-ansible that will, in turn, contain some other files and directories. One of these directories is the inventory/ directory, which contains a sample that you can clone and modify to let Ansible know about your VMs. To do this, run the following command from within the k3s-ansible/ directory:

cp -R inventory/sample inventory/my-cluster

Next, you will need to edit inventory/my-cluster/hosts.ini to reflect the details of your node VMs correctly. Open this file and edit it so that the contents are as follows (where placeholders surrounded by angled brackets <> need to be substituted for an appropriate value):

[master]
<k3s-primary ip address>

[node]
<k3s-replica-1 ip address>
<k3s-replica-2 ip address (if you made this VM)>

[k3s_cluster:children]
master
node

You will also need to edit inventory/my-cluster/group_vars/all.yml. Specifically, the ansible_user value needs to be updated to reflect the username you set up for your VMs previously (ubuntu, if you are following along with the tutorial). After this change, the file should look something like this:

---
k3s_version: v1.22.3+k3s1
ansible_user: ubuntu
systemd_dir: /etc/systemd/system
master_ip: "{{ hostvars[groups['master'][0]]['ansible_host'] | default(groups['master'][0]) }}"
extra_server_args: ''
extra_agent_args: ''

Now you are almost ready to run the playbook, but there is one more thing to be aware of. Ubuntu asked if you wanted to import SSH keys from GitHub during the VM installation process. If you did this, you should be able to SSH into the node VMs using the SSH key present on the device you are working on. Still, it is likely that each time you do so, you will be prompted for your SSH key passphrase, which can be pretty disruptive while running a playbook against multiple remote machines. To see this in action, run the following command:

ssh ubuntu@<k3s-primary ip address>

You will likely get a message like Enter passphrase for key '/Users/<username>/.ssh/id_rsa':, which will occur every time you use this key, including when running Ansible. To avoid this prompt, you can run ssh-add, which will ask you for your password and add this identity to your authentication agent. This means that Ansible won’t need to prompt you for your password multiple times. If you are not comfortable leaving this identity in the authentication agent, you can run ssh-add -D after you are done with the tutorial to remove it again.

Once you have added your SSH key’s passphrase, you can run the following command from the k3s-ansible/ directory to run the playbook:

ansible-playbook site.yml -i inventory/my-cluster/hosts.ini -K

Note that the -K flag here will cause Ansible to prompt you for the become password, which is the password of the ubuntu user on the VM. This will be used so that Ansible can execute commands as sudo when needed.

After running the above command, Ansible will now play through the tasks it needs to run to set up your cluster. When it is done, you should see some output like this:

playbook completed

If you see this output, you should be able to SSH into your k3s-primary VM and verify that the nodes are correctly registered. To do this, first run ssh ubuntu@<k3s-primary ip address>. Then, once you are connected, run the following commands:

sudo kubectl version

This should show you the version of both the kubectl client and the underlying Kubernetes server. If you see these version numbers, it is a good sign, as it shows that the client can communicate with the API:

Kubectl version

Next, run the following command to see all the nodes in your cluster:

sudo kubectl get nodes

If all is well, you should see all of your VMs represented in this output:

Kubectl get nodes

Finally, to run a simple workload on your new cluster, you can run the following command:

sudo kubectl apply -f https://raw.githubusercontent.com/kubernetes/website/main/content/en/examples/pods/simple-pod.yaml

This will create a new simple pod on your cluster. You can then inspect this newly created pod to see which node it is running on, like so:

sudo kubectl get pods -o wide

Specifying the output format with -o wide ensures that you will see some additional information, such as which node it is running on:

Kubectl get pods

You may have noticed that the kubectl commands above are prefixed with sudo. This isn’t usually necessary, but when following the K3s.io installation instructions, you can often run into a scenario where sudo is required. If you prefer to avoid using sudo to run your kubectl commands, there is a good resource here on how to get around this issue.

In summary

In this tutorial, you’ve seen how to set up multiple virtual machines and then configure them into a single Kubernetes cluster using K3s and Ansible via the official K3s.io playbook. Ansible is a powerful IT automation tool that can save you a lot of time when it comes to provisioning and setting up infrastructure, and K3s is the perfect use case to demonstrate this, as manually configuring a multinode cluster can be pretty time-consuming. K3s is just one of the offerings from the team at SUSE, who specialize in business-critical Linux applications, enterprise container management, and solutions for edge computing.

Get started with K3s

Take K3s for a spin!

Stupid Simple Service Mesh: What, When, Why

Montag, 18 April, 2022

Recently microservices-based applications became very popular and with the rise of microservices, the concept of Service Mesh also became a very hot topic. Unfortunately, there are only a few articles about this concept and most of them are hard to digest.

In this blog, we will try to demystify the concept of Service Mesh using „Stupid Simple“ explanations, diagrams, and examples to make this concept more transparent and accessible for everyone. In the first article, we will talk about the basic building blocks of a Service Mesh and we will implement a sample application to have a practical example of each theoretical concept. In the next articles, based on this sample app, we will touch more advanced topics, like Service Mesh in Kubernetes, and we will talk about some more advanced Service Mesh implementations like IstioLinkerd, etc.

To understand the concept of Service Mesh, the first step is to understand what problems it solves and how it solves them.

Software architecture has evolved a lot in a short time, from classical monolithic architecture to microservices. Although many praise microservice architecture as the holy grail of software development, it introduces some serious challenges.

Overview of the sample application

For one, a microservices-based architecture means that we have a distributed system. Every distributed system has challenges such as transparencysecurityscalabilitytroubleshooting, and identifying the root cause of issues. In a monolithic system, we can find the root cause of a failure by tracing. But in a microservice-based system, each service can be written in different languages, so tracing is no trivial task. Another challenge is service-to-service communication. Instead of focusing on business logic, developers need to take care of service discoveryhandle connection errorsdetect latencyretry logic, etc. Applying SOLID principles on the architecture level means that these kinds of network problems should be abstracted away and not mixed with the business logic. This is why we need Service Mesh.

Ingress Controller vs. API Gateway vs. Service Mesh

As I mentioned above, we need to apply SOLID principles on an architectural level. For this, it is important to set the boundaries between Ingress Controller, API Gateway, and Service Mesh and understand each one’s role and responsibility.

On a stupid simple and oversimplified level, these are the responsibilities of each concept:

  1. Ingress Controller: allows a single IP port to access all services from the cluster, so its main responsibilities are path mapping, routing and simple load balancing, like a reverse proxy
  2. API Gatewayaggregates and abstracts away APIs; other responsibilities are rate-limiting, authentication, and security, tracing, etc. In a microservices-based application, you need a way to distribute the requests to different services, gather the responses from multiple/all microservices, and then prepare the final response to be sent to the caller. This is what an API Gateway is meant to do. It is responsible for client-to-service communication, north-south traffic.
  3. Service Mesh: responsible for service-to-service communication, east-west traffic. We’ll dig more into the concept of Service Mesh in the next section.

Service Mesh and API Gateway have overlapping functionalities, such as rate-limiting, security, service discovery, tracing, etc. but they work on different levels and solve different problems. Service Mesh is responsible for the flow of requests between services. API Gateway is responsible for the flow of requests between the client and the services, aggregating multiple services and creating and sending the final response to the client.

The main responsibility of an API gateway is to accept traffic from outside your network and distribute it internally, while the main responsibility of a service mesh is to route and manage traffic within your network. They are complementary concepts and a well-defined microservices-based system should combine them to ensure application uptime and resiliency while ensuring that your applications are easily consumable.

What Does a Service Mesh Solve?

As an oversimplified and stupid simple definition, a Service Mesh is an abstraction layer hiding away and separating networking-related logic from business logic. This way developers can focus only on implementing business logic. We implement this abstraction using a proxy, which sits in the front of the service. It takes care of all the network-related problems. This allows the service to focus on what is really important: the business logic. In a microservice-based architecture, we have multiple services and each service has a proxy. Together, these proxies are called Service Mesh.

As best practices suggest, proxy and service should be in separate containers, so each container has a single responsibility. In the world of Kubernetes, the container of the proxy is implemented as a sidecar. This means that each service has a sidecar containing the proxy. A single Pod will contain two containers: the service and the sidecar. Another implementation is to use one proxy for multiple pods. In this case, the proxy can be implemented as a Deamonset. The most common solution is using sidecars. Personally, I prefer sidecars over Deamonsets, because they keep the logic of the proxy as simple as possible.

There are multiple Service Mesh solutions, including IstioLinkerdConsulKong, and Cilium. (We will talk about these solutions in a later article.) Let’s focus on the basics and understand the concept of Service Mesh, starting with Envoy. This is a high-performance proxy and not a complete framework or solution for Service Meshes (in this tutorial, we will build our own Service Mesh solution). Some of the Service Mesh solutions use Envoy in the background (like Istio), so before starting with these higher-level solutions, it’s a good idea to understand the low-level functioning.

Understanding Envoy

Ingress and Egress

Simple definitions:

  • Any traffic sent to the server (service) is called ingress.
  • Any traffic sent from the server (service) is called egress.

The Ingress and the Egress rules should be added to the configuration of the Envoy proxy, so the sidecar will take care of these. This means that any traffic to the service will first go to the Envoy sidecar. Then the Envoy proxy redirects the traffic to the real service. Vice-versa, any traffic from this service will go to the Envoy proxy first and Envoy resolves the destination service using Service Discovery. By intercepting the inbound and outbound traffic, Envoy can implement service discovery, circuit breaker, rate limiting, etc.

The Structure of an Envoy Proxy Configuration File

Every Envoy configuration file has the following components:

  1. Listeners: where we configure the IP and the Port number that the Envoy proxy listens to
  2. Routes: the received request will be routed to a cluster based on rules. For example, we can have path matching rules and prefix rewrite rules to select the service that should handle a request for a specific path/subdomain. Actually, the route is just another type of filter, which is mandatory. Otherwise, the proxy doesn’t know where to route our request.
  3. Filters: Filters can be chained and are used to enforce different rules, such as rate-limiting, route mutation, manipulation of the requests, etc.
  4. Clusters: act as a manager for a group of logically similar services (the cluster has similar responsibility as a service in Kubernetes; it defines the way a service can be accessed), and acts as a load balancer between the services.
  5. Service/Host: the concrete service that handles and responds to the request

Here is an example of an Envoy configuration file:

---
admin:  
  access_log_path: "/tmp/admin_access.log"  
  address:     
    socket_address: 
      address: "127.0.0.1" 
      port_value: 9901
static_resources:   
  listeners:    
   -       
      name: "http_listener"      
      address:         
        socket_address:           
          address: "0.0.0.0"          
          port_value: 80      
      filter_chains:          
        filters:             
          -               
            name: "envoy.http_connection_manager"              
            config:                
              stat_prefix: "ingress"                
              codec_type: "AUTO"               
              generate_request_id: true                
              route_config:                   
                name: "local_route"                  
                virtual_hosts:                    
                  -                       
                    name: "http-route"                      
                    domains:                         
                      - "*"                      
                    routes:                       
                      -                           
                        match:                             
                          prefix: "/nestjs"                          
                        route:                            
                          prefix_rewrite: "/"                            
                          cluster: "nestjs"                        
                      -                           
                        match:                             
                            prefix: "/nodejs"                          
                          route:                            
                            prefix_rewrite: "/"                            
                            cluster: "nodejs"                         
                       -                           
                         match:                             
                           path: "/"                          
                         route:                            
                           cluster: "base"                
              http_filters:                  
                -                     
                  name: "envoy.router"                    
                  config: {}  

  clusters:    
    -       
      name: "base"      
      connect_timeout: "0.25s"      
      type: "strict_dns"      
      lb_policy: "ROUND_ROBIN"      
      hosts:        
        -           
          socket_address:             
            address: "service_1_envoy"            
            port_value: 8786        
        -           
          socket_address:             
            address: "service_2_envoy"            
            port_value: 8789        
    -      
      name: "nodejs"      
      connect_timeout: "0.25s"      
      type: "strict_dns"      
      lb_policy: "ROUND_ROBIN"      
      hosts:        
        -          
          socket_address:            
            address: "service_4_envoy"            
            port_value: 8792        
    -      
      name: "nestjs"      
      connect_timeout: "0.25s"      
      type: "strict_dns"      
      lb_policy: "ROUND_ROBIN"      
      hosts:        
        -          
          socket_address:            
            address: "service_5_envoy"            
            port_value: 8793

The configuration file above translates into the following diagram:

This diagram did not include all configuration files for all the services, but it is enough to understand the basics. You can find this code in my Stupid Simple Service Mesh repository.

As you can see, between lines 10-15 we defined the Listener for our Envoy proxy. Because we are working in Docker, the host is 0.0.0.0.

After configuring the listener, between lines 15-52 we define the Filters. For simplicity we used only the basic filters, to match the routes and to rewrite the target routes. In this case, if the subdomain is „host:port/nodeJs,“ the router will choose the nodejs cluster and the URL will be rewritten to „host:port/“ (this way the request for the concrete service won’t contain the /nodesJs part). The logic is the same also in the case of „host:port/nestJs“. If we don’t have a subdomain in the request, then the request will be routed to the cluster called base without prefix rewrite filter.

Between lines 53-89 we defined the clusters. The base cluster will have two services and the chosen load balancing strategy is round-robin. Other available strategies can be found here. The other two clusters (nodejs and nestjs) are simple, with only a single service.

The complete code for this tutorial can be found in my Stupid Simple Service Mesh git repository.

Conclusion

In this article, we learned about the basic concepts of Service Mesh. In the first part, we understood the responsibilities and differences between the Ingress Controller, API Gateway, and Service Mesh. Then we talked about what Service Mesh is and what problems it solves. In the second part, we introduced Envoy, a performant and popular proxy, which we used to build our Service Mesh example. We learned about the different parts of the Envoy configuration files and created a Service Mesh with five example services and a front-facing edge proxy.

In the next article, we will look at how to use Service Mesh with Kubernetes and will create an example project that can be used as a starting point in any project using microservices.

There is another ongoing “Stupid Simple AI” series. The first two articles can be found here: SVM and Kernel SVM and KNN in Python.

Want to Learn More from our Stupid Simple Series?

Read our eBook: Stupid Simple Kubernetes. Download it here!

Lösungen für Finanzdienstleister: SUSE hilft Banken und Versicherungen, sich neu zu erfinden

Donnerstag, 14 April, 2022

Um auch in Zukunft relevant zu bleiben, müssen Finanzdienstleister ihre Geschäftsmodell weiterentwickeln und sich auf komplett veränderte Kundenerwartungen einstellen. Die große Herausforderung ist dabei, digitale Innovationen umzusetzen – ohne Kompromisse bei der Datensicherheit einzugehen. Der neue Financial Services Guide von SUSE beschreibt, wie das gelingen kann.

In kaum einer anderen Branche ist der Veränderungsdruck derzeit so hoch wie im Finanzdienstleistungssektor. Die nächste Kundengeneration hat ganz andere Vorstellungen davon, wie Services rund um Zahlungsverkehr, Vermögensbildung und persönliche Absicherung aussehen sollen. Gleichzeitig drängen smarte FinTech-Startups und große Technologiekonzerne mit eigenen Dienstleistungen in den Markt und verschärfen dadurch den Wettbewerb.

Die etablierten Banken und Versicherungen müssen daher ihr Angebot schnell auf neue Kanäle ausdehnen, um ihre Zielgruppen weiterhin zu erreichen. Themen wie App- Plattformen, White-Label-Services, QR-Zahlungen und Social Media Banking gewinnen immer stärker an Bedeutung. Gleichzeitig brauchen Finanzdienstleister neue Technologien, die ihnen helfen, Marktinformationen intelligent auszuwerten und Services genau auf die persönlichen Bedürfnisse ihrer Kunden auszurichten.

Insbesondere diese vier Herausforderungen werden die Finanzbranche in den nächsten Jahren beschäftigen:

  • Aufbau von agilen, digitalen Ökosystemen: Finanzdienstleister müssen sich vom Silodenken verabschieden und vernetzte Strukturen aufbauen, die sich schnell an veränderte Kunden- und Marktanforderungen anpassen lassen.
  • Weiterentwicklung von Geschäfts- und Betriebsmodellen: Die Zeiten, in denen Finanzdienstleister zuverlässig Umsatz durch passive Kunden generieren, sind vorbei. Nur wenn sie ihr Business ganz auf Kundenmehrwerte ausrichten, bleiben sie im digitalen Wettbewerb relevant.
  • Stärkung von Sicherheit und Compliance: Digitale Infrastrukturen in der Finanzbranche sind heute massiven Cyberbedrohungen ausgesetzt. Daher müssen Banken und Versicherungen jederzeit sicherstellen, dass alle Daten und Prozesse umfassend vor Risiken geschützt sind.
  • Kontinuierliche Innovation: In der digitalen Welt spielt die Customer Experience eine ganz entscheidende Rolle. Technologischer Stillstand führt schnell dazu, dass sich Kunden nach Alternativen umsehen. Finanzdienstleister können ihre Kunden nur dauerhaft binden, wenn sie sie immer wieder mit innovativen Lösungen begeistern.

Laden Sie jetzt unseren neuen Financial Services Guide herunter und erfahren Sie, wie Banken und Versicherungen in Zukunft wettbewerbsfähig bleiben. In dem Dokument lesen Sie auch, warum führende Finanzdienstleister wie WWK, Fitch Ratings und Cardano auf Technologien von SUSE setzen.


IDC-Whitepaper: Wie Harvester die Kluft zwischen Legacy- und Cloud-native IT schließen kann

Mittwoch, 23 März, 2022

Die Containerisierung von Geschäftsanwendungen nimmt stark zu, aber auch traditionelle virtualisierte Workloads spielen für die Business-IT weiterhin eine wichtige Rolle. Neue Lösungen wie die offene HCI-Plattform Harvester von SUSE zielen darauf, eine Brücke zwischen beiden Welten zu schlagen. Welche Vorteile dieser Ansatz für Unternehmen bietet, zeigt ein aktuelles IDC-Whitepaper.

Die Analysten von IDC prognostizieren, dass die Verbreitung von Containern in den nächsten Jahren stark zunehmen wird: Schon 2023 könnte das Marktvolumen aller installierten Container-Instanzen einen Wert von fast zwei Milliarden US-Dollar erreichen (2019: 303 Millionen US-Dollar). Gleichzeitig verzeichnet aber auch der ausgereifte Markt für Virtualisierung weiterhin hohe Wachstumsraten. Vor allem in Public Cloud-Umgebungen, aber auch in On-Premises-Infrastrukturen steigt die Anzahl der virtuellen Maschinen (VMs) kontinuierlich.

Für Unternehmen ist es derzeit sinnvoll, sowohl auf VMs als auch auf Container zu setzen. Denn beide Technologien können ihnen helfen, ihren IT-Betrieb zu vereinfachen. Während VMs die physische Hardware abstrahieren, entkoppeln Container die Anwendungen vom Betriebssystem. Um die Synergien beider Technologien zu nutzen, müssen diese allerdings an den unterschiedlichsten Standorten bereitgestellt werden: in der Cloud, im Rechenzentrum und auch im Edge-Bereich.

Genau für diesen Zweck hat SUSE Harvester entwickelt – eine hyperkonvergente Infrastrukturlösung (HCI), die komplett auf Open Source-Technologien wie Kubernetes, Longhorn und KubeVirt basiert. Unternehmen können damit eine zentrale Verwaltungsplattform für virtualisierte und containerisierte Umgebungen aufbauen, ihre vorhandene Infrastruktur vereinheitlichen und gleichzeitig die Einführung von Containern von Core bis Edge beschleunigen.

Harvester führt also traditionelle und Cloud-native IT zusammen und erleichtert so die Modernisierung von IT-Infrastrukturen. Ein aktuelles Whitepaper von IDC analysiert die Möglichkeiten, die sich daraus ergeben:

  • Unternehmen können HCI-Instanzen an entfernten Standorten replizieren – etwa in Produktionsstätten oder Einzelhandelsfilialen – und sie über eine einzige Schnittstelle verwalten.
  • Die enge Integration von Harvester mit Kubernetes und SUSE Rancher ermöglicht Multi-Cluster-Management und Lastausgleich von persistenten Speicherressourcen – sowohl für virtuelle Maschinen als auch für Container.
  • Durch die Ausführung von KI und Analysen in Edge- und Remote-Umgebungen werden Daten näher am Entstehungsort verarbeitet. Das spart Bandbreitenkosten und liefert schneller Ergebnisse, die für Geschäftsentscheidungen genutzt werden können.
  • Harvester erfüllt auch die Anforderungen von DevOps-Teams und vereinfacht den IT-Betrieb: Generalisten ohne spezielles Know-how sind damit in der Lage, Ressourcen für VM- und Container-Umgebungen bereitzustellen.
  • Da Harvester nicht auf proprietären SAN-Technologien und hardwareabhängigen HCI-Lösungen basiert, lassen sich die Gesamtbetriebskosten über den gesamten Infrastruktur-Stack hinweg senken.

Das komplette Whitepaper „Bridging the Legacy-to-Cloud-Native IT Journey with Harvester“ können Sie hier herunterladen.


Stupid Simple Kubernetes: Service Mesh

Mittwoch, 16 Februar, 2022

We covered the what, when and why of Service Mesh in a previous post. Now I’d like to talk about why they are critical in Kubernetes. 

To understand the importance of using service meshes when working with microservices-based applications, let’s start with a story.  

Suppose that you are working on a big microservices-based banking application, where any mistake can have serious impacts. One day the development team receives a feature request to add a rating functionality to the application. The solution is obvious: create a new microservice that can handle user ratings. Now comes the hard part. The team must come up with a reasonable time estimate to add this new service.  

The team estimates that the rating system can be finished in 4 sprints. The manager is angry. He cannot understand why it is so hard to add a simple rating functionality to the app.  

To understand the estimate, let’s understand what we need to do in order to have a functional rating microservice. The CRUD (Create, Read, Update, Delete) part is easy — just simple coding. But adding this new project to our microservices-based application is not trivial. First, we have to implement authentication and authorization, then we need some kind of tracing to understand what is happening in our application. Because the network is not reliable (unstable connections can result in data loss), we have to think about solutions for retries, circuit breakers, timeouts, etc.  

We also need to think about deployment strategies. Maybe we want to use shadow deployments to test our code in production without impacting the users. Maybe we want to add A/B testing capabilities or canary deployments. So even if we create just a simple microservice, there are lots of cross-cutting concerns that we have to keep in mind.  

Sometimes it is much easier to add new functionality to an existing service than create a new service and add it to our infrastructure. It can take a lot of time to deploy a new service, add authentication and authorization, configure tracing, create CI/CD pipelines, implement retry mechanisms and more. But adding the new feature to an existing service will make the service too big. It will also break the rule of single responsibility, and like many existing microservices projects, it will be transformed into a set of connected macroservices or monoliths. 

We call this the cross-cutting concerns burden — the fact that in each microservice you must reimplement the cross-cutting concerns, such as authentication, authorization, retry mechanisms and rate limiting. 

What is the solution to this burden? Is there a way to implement all these concerns once and inject them into every microservice, so the development team can focus on producing business value? The answer is Istio.  

Set Up a Service Mesh in Kubernetes Using Istio  

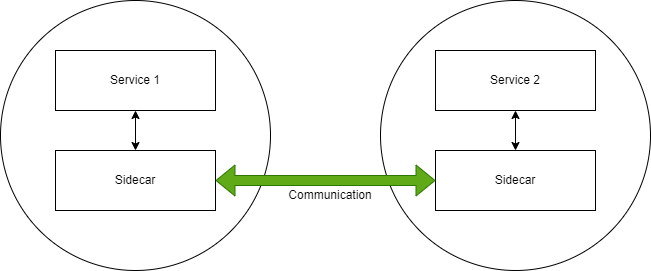
Istio solves these issues using sidecars, which it automatically injects into your pods. Your services won’t communicate directly with each other — they’ll communicate through sidecars. The sidecars will handle all the cross-cutting concerns. You define the rules once, and these rules will be injected automatically into all of your pods.   

Sample Application 

Let’s put this idea into practice. We’ll build a sample application to explain the basic functionalities and structure of Istio.  

In the previous post, we created a service mesh by hand, using envoy proxies. In this tutorial, we will use the same services, but we will configure our Service Mesh using Istio and Kubernetes.  

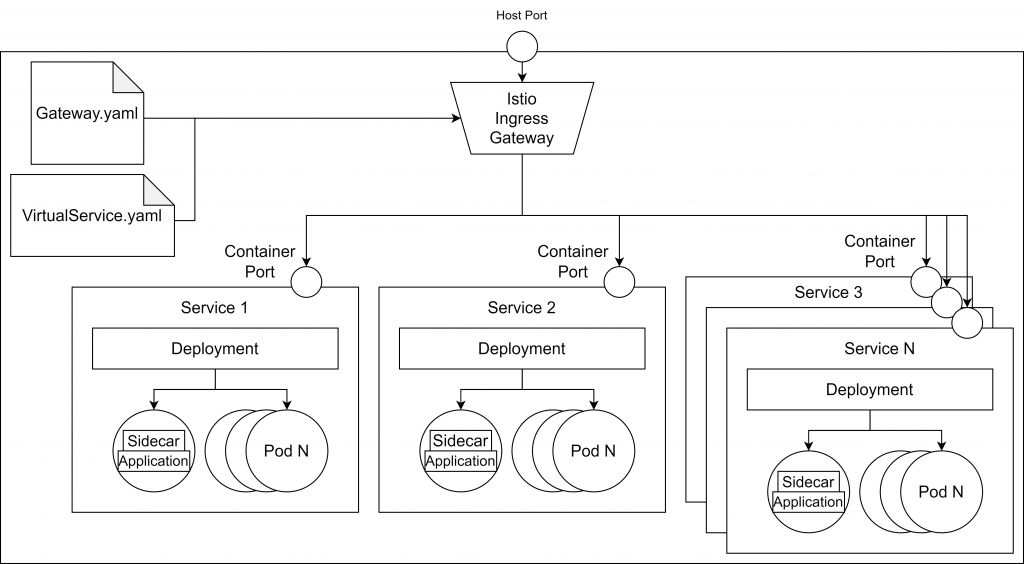
The image below depicts that application architecture.  


  1. Kubernetes(we used the 1.21.3 version in this tutorial) 
  1. Helm (we used the v2) 
  1. Istio (we used 1.1.17) - setup tutorial 
  1. Minikube, K3s or Kubernetes cluster enabled in Docker 

Git Repository 

My Stupid Simple Service Mesh in Kubernetes repository contains all the scripts for this tutorial. Based on these scripts you can configure any project. 

Running Our Microservices-Based Project Using Istio and Kubernetes 

As I mentioned above, step one is to configure Istio to inject the sidecars into each of your pods from a namespace. We will use the default namespace. This can be done using the following command: 

kubectl label namespace default istio-injection=enabled 

In the second step, we navigate into the /kubernetes folder from the downloaded repository, and we apply the configuration files for our services: 

kubectl apply -f service1.yaml 
kubectl apply -f service2.yaml 
kubectl apply -f service3.yaml 

After these steps, we will have the green part up and running: 


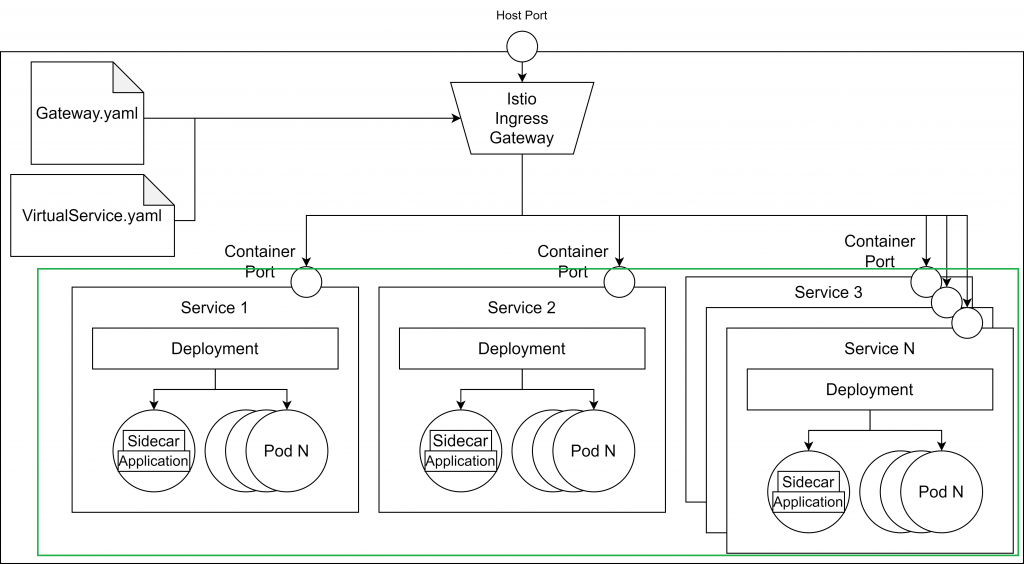
For now, we can’t access our services from the browser. In the next step, we will configure the Istio Ingress and Gateway, allowing traffic from the exterior. 

The gateway configuration is as follows: 

apiVersion: networking.istio.io/v1alpha3 
kind: Gateway 
metadata:   
    name: http-gateway 
spec: 
    selector:  
        istio: ingressgateway 
    servers: 
        - port: 
            number: 80 
            name: http 
            protocol: HTTP 
        hosts:    - “*”  

Using the selector istio: ingressgateway, we specify that we would like to use the default ingress gateway controller, which was automatically added when we installed Istio. As you can see, the gateway allows traffic on port 80, but it doesn’t know where to route the requests. To define the routes, we need a so-called VirtualService, which is another custom Kubernetes resource defined by Istio. 

apiVersion: networking.istio.io/v1b 
kind: VirtualService 
metadata: 
    name: sssm-virtual-services 
spec: 
    hosts:  - "*" 
    gateways:  - http-gateway 
    http:   
        - match: 
            - uri: 
                prefix: /service1 
            route: 
                - destination: 
                    host: service1 
                    port: 
                        number: 80 
        - match: 
            - uri: 
                prefix: /service2 
            route: 
                - destination: 
                    host: service2 
                    port: 
                        number: 80 

The code above shows an example configuration for the VirtualService. In line 7, we specified that the virtual service applies to the requests coming from the gateway called http-gateway and from line 8 we define the rules to match the services where the requests should be sent. Every request with /service1 will be routed to the service1 container while every request with /service2 will be routed to the service2 container. 

At this step, we have a working application. Until now there is nothing special about Istio — you can get the same architecture with a simple Kubernetes Ingress controller, without the burden of sidecars and gateway configuration.  

Now let’s see what we can do using Istio rules. 

Security in Istio 

Without Istio, every microservice must implement authentication and authorization. Istio removes the responsibility of adding authentication and authorization from the main container (so developers can focus on providing business value) and moves these responsibilities into its sidecars. The sidecars can be configured to request the access token at each call, making sure that only authenticated requests can reach our services. 

apiVersion: authentication.istio.io/v1beta1 
kind: Policy 
metadata: 
    name: auth-policy 
spec:   
    targets:   
        - name: service1   
        - name: service2   
        - name: service3  
        - name: service4   
        - name: service5   
    origins:  
    - jwt:       
        issuer: "{YOUR_DOMAIN}"      
        jwksUri: "{YOUR_JWT_URI}"   
    principalBinding: USE_ORIGIN 

As an identity and access management server, you can use Auth0, Okta or other OAuth providers. You can learn more about authentication and authorization using Auth0 with Istio in this article. 

Traffic Management Using Destination Rules 

Istio’s official documentation says that the DestinationRule „defines policies that apply to traffic intended for a service after routing has occurred.“ This means that the DestionationRule resource is situated somewhere between the Ingress controller and our services. Using DestinationRules, we can define policies for load balancing, rate limiting or even outlier detection to detect unhealthy hosts.  

Shadowing 

Shadowing, also called Mirroring, is useful when you want to test your changes in production silently, without affecting end users. All the requests sent to the main service are mirrored (a copy of the request) to the secondary service that you want to test. 

Shadowing is easily achieved by defining a destination rule using subsets and a virtual service defining the mirroring route.  

The destination rule will be defined as follows: 

apiVersion: networking.istio.io/v1beta1 
kind: DestinationRule 
metadata:   
    name: service2 
spec:   
    host: service2 
    subsets:   
    - name: v1      
      labels:       
          version: v1 
    - name: v2     
      labels:       
          version: v2 

As we can see above, we defined two subsets for the two versions.  

Now we define the virtual service with mirroring configuration, like in the script below: 

apiVersion: networking.istio.io/v1alpha3 
kind: VirtualService 
metadata:   
    name: service2 
spec:   
    hosts:     
    - service2   
    http:   
    - route:     
        - destination:         
          host: service2 
          subset: v1            
        mirror:       
            host: service2 
            subset: v2 

In this virtual service, we defined the main destination route for service2 version v1. The mirroring service will be the same service, but with the v2 version tag. This way the end user will interact with the v1 service, while the request will also be sent also to the v2 service for testing. 

Traffic Splitting 

Traffic splitting is a technique used to test your new version of a service by letting only a small part (a subset) of users to interact with the new service. This way, if there is a bug in the new service, only a small subset of end users will be affected.  

This can be achieved by modifying our virtual service as follows: 

apiVersion: networking.istio.io/v1alpha3 
kind: VirtualService 
metadata:   
    name: service2 
spec:   
    hosts:     
    - service2  
    http:   
    - route:     
        - destination:         
              host: service2         
              subset: v1       
         weight: 90            
         - destination:         
               host: service2 
               subset: v2       
         weight: 10    

The most important part of the script is the weight tag, which defines the percentage of the requests that will reach that specific service instance. In our case, 90 percent of the request will go to the v1 service, while only 10 percent of the requests will go to v2 service. 

Canary Deployments 

In canary deployments, newer versions of services are incrementally rolled out to users to minimize the risk and impact of any bugs introduced by the newer version. 

This can be achieved by gradually decreasing the weight of the old version while increasing the weight of the new version. 

A/B Testing 

This technique is used when we have two or more different user interfaces and we would like to test which one offers a better user experience. We deploy all the different versions and we collect metrics about the user interaction. A/B testing can be configured using a load balancer based on consistent hashing or by using subsets. 

In the first approach, we define the load balancer like in the following script: 

apiVersion: networking.istio.io/v1alpha3 
kind: DestinationRule 
metadata:   
    name: service2 
spec:   
    host: service2 
    trafficPolicy:     
        loadBalancer:       
            consistentHash:         
                httpHeaderName: version 

As you can see, the consistent hashing is based on the version tag, so this tag must be added to our service called „service2“, like this (in the repository you will find two files called service2_v1 and service2_v2 for the two different versions that we use): 

apiVersion: apps/v1 
kind: Deployment 
metadata:   
    name: service2-v2   
    labels:     
        app: service2 
spec:   
    selector:     
        matchLabels:       
            app: service2   
    strategy:     
        type: Recreate   
    template:     
        metadata:      
            labels:         
                app: service2         
                version: v2     
        spec:       
            containers:       
            - image: zoliczako/sssm-service2:1.0.0         
              imagePullPolicy: Always         
              name: service2         
              ports:           
              - containerPort: 5002         
              resources:           
                  limits:             
                      memory: "256Mi"             
                      cpu: "500m" 

The most important part to notice is the spec -> template -> metadata -> version: v2. The other service has the version: v1 tag. 

The other solution is based on subsets. 

Retry Management 

Using Istio, we can easily define the maximum number of attempts to connect to a service if the initial attempt fails (for example, in case of overloaded service or network error). 

The retry strategy can be defined by adding the following lines to the end of our virtual service: 

retries:   
    attempts: 5 
    perTryTimeout: 10s 

With this configuration, our service2 will have five retry attempts in case of failure and it will wait 10 seconds before returning a timeout. 

Learn more about traffic management in this article. You’ll find a great workshop to configure an end-to-end service mesh using Istio here. 

Conclusion 

In this chapter, we learned how to set up and configure a service mesh in Kubernetes using Istio. First, we configured an ingress controller and gateway and then we learned about traffic management using destination rules and virtual services.  

Want to Learn More from our Stupid Simple Series?

Read our eBook: Stupid Simple Kubernetes. Download it here!

Scale Your Infrastructure with Cloud Native Technology

Mittwoch, 16 Februar, 2022

When business is growing rapidly, the necessity to scale the processes is obvious. If your initial infrastructure hasn’t been thought through with scalability in mind, growing your infrastructure may be quite painful. The common tactic, in this case, is to transition to cloud native architecture.

In this post, we will talk about what you need to know when you’re scaling up with the cloud so that you can weigh the pros and cons and make an informed decision. 

What is Cloud Technology?

Cloud computing is the on-demand delivery of IT resources—applications, storage, databases, networking and more—over the Internet (“the cloud”). It has quickly become popular because it allows enterprises to expand without extra work to manage their resources. Cloud services providers can provide you with as much storage space as you need, regardless of how big the organization is. Cloud native computing is a programming approach that is designed to take advantage of the cloud computing model. It uses open source software that supports its three key elements: Containerization, orchestration of the containers and microservices.

Why Do You Need the Cloud in Your Organization? 

In 2021, 94% of companies used cloud technology in some capacity. This huge popularity can be attributed to several reasons:

Convenience

As we’ve already mentioned, scalability is one of the main advantages that make businesses transition to this model. With on-premise storage, you have to purchase new equipment, set up servers and even expand your team in the case of drastic growth. But with the cloud, you only need to click a couple of buttons to expand your cloud storage size and make a payment, which is, of course, much simpler.

Flexibility

Cloud native architecture makes your company more flexible and responsive to the needs of both clients and employees. Your employees can enjoy the freedom of working from any place on their own devices. Having a collaborative space is rated by both business owners and employees as very important. 

Being able to access and edit files in the cloud easily is also crucial when working with clients. Your company and clients can build an efficient working relationship regardless of the geographic location.

Cost

Data that companies need to store accumulates quickly, fueled by new types of workloads. However, your costs can’t grow at the same pace.

Cloud services allow you to spend more responsibly; necessary IT resources can be rented for as much time as you need and easily canceled. Companies that work in industries facing sharp seasonal increases in the load on information systems especially benefit from the cloud.

Types of Cloud Native Solutions

Cloud native solutions is an umbrella term for different services. You can choose the model that works best for you. 

Platform as a Service (PaaS)

Platform as a service is a cloud environment that contains everything you need to support the full lifecycle of cloud applications. You avoid the complexities and costs associated with hardware and software setup.

Infrastructure as a Service (IaaS)

Infrastructure as a service enables companies to rent servers and data centers instead of building up their own from zero. You get an all-inclusive solution so that you can start scaling your business processes in no time. However, the implementation of IaaS can result in a large overhead.

Software as a Service (SaaS)

In this model, your applications run on remote computers “in the cloud.” These servers are owned and maintained by other companies. The connection between these computers and users’ computers happens via the internet, usually using a Web browser.

Cloud Deployment Models: Public vs. Private

Cloud comes in many types that you can use based on your business needs: public cloud, private cloud, hybrid cloud, and multi-cloud. Let’s find out which one fits your organization.

Public Cloud

Public clouds are run by companies that offer fast access to low-cost computing resources over the public network. With public cloud services, users do not need to purchase hardware, software, and underlying infrastructure—in other words, the service provider decides.

Private Cloud

A private cloud is an infrastructure for one organization only, managed internally or by third parties, and located on or off the organization’s premises. Private clouds can take advantage of public cloud environments and at the same time ensure greater control over resources and avoid the problems associated with working on a collective lease.

Hybrid Cloud

In a hybrid cloud, a private cloud is used as the foundation, combined with strategic integration and public cloud services. Most companies with private clouds will eventually move to workload management across multiple data centers, private clouds, and public clouds — that is, they will move to hybrid clouds.

Multi-Cloud

Many organizations adopt various cloud services to drive innovation and increase business agility, including generating new revenue streams, adding products and services, and increasing profits. With its wide range of potential benefits, multi-cloud environments are essential to the survival and success of the digital era.

Cloud Services as Business Tools

Some companies need the cloud more than others. Industries that can greatly benefit from cloud adoption are retail, insurance, and hospitality. 

Using cloud resources, companies in these industries organize backup data processing centers (RDCs) and ensure the necessary infrastructure for creating and debugging applications, storing archives, etc.

However, any company can benefit from cloud adoption, especially if your employees work collaboratively with documents, files, and other types of content. Small and medium-sized businesses are increasingly interested in platform services, such as cloud database management systems, and large companies organize information storage from disparate sources in the cloud.

How to Make Transformation Painless

Before you transform your processes:

-Start with the education of your team.

-Talk to your teammates about how moving to the cloud will help them perform daily tasks more easily. Your colleagues might not immediately understand that cloud solutions provide better collaboration or higher security options.

-Ensure that they have the necessary resources to explore and learn about new tools.

Any cloud service providers such as Amazon provide coaching. Depending on the resources, you can hire new team members that already have the necessary competencies to facilitate the transition. Just remember that to be painless, cloud migration should happen in an organized and step-by-step way.

There can be quite a few options for cloud migration. At first, you can migrate only part of your workload to the cloud while combining it with the on-premises approach. 

Cloud Transformation Stages

Now let’s talk a bit more about cloud transformation stages. They may differ based on the company’s needs and can be carried out independently or with the involvement of external experts for consultations. 

Developing a Migration Strategy

The first step to a successful migration to the cloud is to develop a business plan where you define the needs of your business, set up goals, and agree on technical aspects. Usually, you perform one or more brainstorming sessions with your internal team and then perfect the model you have with your third-party consultants or service provider. You need to decide which type of cloud product you prefer and choose your deployment method.

Auditing the Company’s Existing IT Infrastructure

To add details to your cloud adoption strategy, you need to audit the company’s infrastructure. Application rationalization is the process of going through all the applications used in the company to determine which to keep and which to let go of. Most companies are doing just that before any efforts to move to the cloud. During this stage, you identify the current bottlenecks that should be solved with the adoption of cloud native architecture. 

Drawing a Migration Roadmap

Together with your team or service provider, you develop a migration roadmap. It should contain the main milestones; for example, it can describe by what time different departments of your company should migrate to the cloud. You might connect with several cloud services providers to negotiate the best conditions for yourself at this stage. 

Migration

Migration to the cloud can take up to several months. However, after migration, you and your employees will transition where you adapt to the new work environment.

Optimization

Difficulties (including technical ones) can arise at every stage. Any migration involves some downtime; that needs to be planned so that the business is not harmed. Often there are problems associated with non-standard infrastructure, or there is a need to implement additional solutions. During the optimization stage, you identify the problems that need to be fixed and develop a defined strategy.

Cloud migration can seem like a tedious process at first. But the benefits that it provides to businesses are worth it. If you choose a cloud product based on your business needs that prepare a long-lasting implementation strategy and dedicate enough time to audit and optimization, you will be pleasantly surprised with the transformation of your processes.

Summing up

Many companies are now transitioning to cloud native technology to scale their infrastructure because it’s more flexible, convenient, and allows cost reduction. Your team can choose from different types of cloud depending on your priorities, whether it be on-premise cloud or IaaS.

Cloud native technology transformation will help you scale your infrastructure and expand your business globally. If you are searching for ways to make your company more flexible to meet both the needs of your employees and your clients, cloud migration might be the best choice for you. 

Join the Conversation!

What’s your cloud transformation story? Join the SUSE & Rancher Community where you’ll find resources to support you in your cloud native journey — from introductory and advanced courses and like-minded peers to offer support.

IDG-Studie „Cloud Native 2022“: Wo stehen europäische Unternehmen bei der digitalen Transformation?

Donnerstag, 27 Januar, 2022

Die Modernisierung von IT-Infrastrukturen nimmt Fahrt auf, aber noch sehen die meisten Unternehmen bei ihrer digitalen Transformation viel Luft nach oben. Zu diesem Ergebnis kommt eine aktuelle Studie von IDG Research Services, die in Zusammenarbeit mit SUSE entstanden ist. Auch wenn die Unterschiede bei der Umsetzung teilweise groß sind – in einem Punkt sind sich die befragten Unternehmen aus Deutschland, Frankreich und Großbritannien einig: Die Zeit ist reif für den Einsatz von Cloud Native-Technologien.

Nur eine Minderheit von Unternehmen in den drei größten Volkswirtschaften Europas fühlt sich derzeit für die digitale Transformation ausreichend gut gerüstet. Laut der aktuellen Cloud Native-Studie von IDG bewerten vor allem deutsche Firmen ihre Aufstellung für die Zukunft skeptisch – sowohl in technologischer als auch in organisatorischer Hinsicht.

Dabei haben Unternehmen in allen drei Ländern erkannt, dass gerade Cloud Native-Technologien großes Potenzial besitzen, den digitalen Wandel zu beschleunigen. IT- und Business-Verantwortliche versprechen sich von Containern und Kubernetes eine höhere Verfügbarkeit ihrer Geschäftsapplikationen, kürzere Entwicklungszyklen, eine bessere Skalierbarkeit und eine schnellere Time-to-Market.

Am Budget scheitert der Einsatz von Cloud Native-Technologien eher nicht. Hürden sind nach Einschätzung der befragten Entscheider vielmehr die vorhandene Infrastruktur, mangelndes Know-how und fehlende Fachkräfte.

Die gesamte Studie von IDG können Sie jetzt kostenfrei herunterladen. Darin erfahren Sie unter anderem:

  • wie IT-Verantwortliche aus Deutschland, Frankreich und Großbritannien bei der Modernisierung ihrer IT heute vorgehen,
  • welche Unternehmen sich gerade besonders intensiv mit Cloud Native-Technologien befassen,
  • wo Unternehmen den größten Nachholbedarf bei der digitalen Transformation sehen,
  • wie die Continental AG Kubernetes als Wegbereiter für eine smarte Fertigung nutzt,
  • welche Handlungsempfehlungen Experten den Entscheidern mit auf den Weg geben.

Die Cloud Native-Studie von IDG beleuchtet die Situation von Unternehmen in Deutschland, Frankreich und Großbritannien mit mindestens 100 Beschäftigten. Befragt wurden 420 strategische (IT-)Entscheider aus dem C-Level und unterschiedlichen zentralen Business-Fachbereichen sowie IT-Führungskräfte.

Die komplette Studie „Cloud Native 2022“ können Sie hier herunterladen.


Kubewarden: Deep Dive into Policy Logging    

Montag, 22 November, 2021
Policies are regular programs. As such, they often need to log information. In general, we are used to making our programs log into standard output (stdout) and standard error (stderr) outputs.

However, policies run in a confined WebAssembly environment. For this mechanism to work per usual, Kubewarden would need to set up the runtime environment so the policy can write to stdout and stderr file descriptors. Upon completion, Kubewarden can check them – or stream log messages as they pop up.

Given that Kubewarden uses waPC for allowing intercommunication between the guest (the policy) and the host (Kubewarden – the policy-server or kwctl if we are running policies manually), we have extended our language SDK’s so that they can log messages by using waPC internally.

Kubewarden has defined a contract between policies (guests) and the host (Kubewarden) for performing policy settings validationpolicy validationpolicy mutation, and logging.

The waPC interface used for logging is a contract because once you have built a policy, it should be possible to run it in future Kubewarden versions. In this sense, Kubewarden keeps this contract behind the SDK of your preferred language, so you don’t have to deal with details of how logging is implemented in Kubewarden. You must use your logging library of choice for the language you are working with.

Let’s look at how to take advantage of logging in with Kubewarden in specific languages!

For Policy Authors

Go

We are going to use the Go policy template as a starting point.

Our Go SDK provides integration with the onelog library. When our policy is built for the WebAssembly target, it will send the logs to the host through waPC. Otherwise, it will just print them on stderr – but this is only relevant if you run your policy outside a Kubewarden runtime environment.

One of the first things our policy does on its main.go file is to initialize the logger:

var (
    logWriter = kubewarden.KubewardenLogWriter{}
    logger    = onelog.New(
        &logWriter,
        onelog.ALL, // shortcut for onelog.DEBUG|onelog.INFO|onelog.WARN|onelog.ERROR|onelog.FATAL
    )
)

We are then able to use onelog API to produce log messages. We could, for example, perform structured logging with debugging level:

logger.DebugWithFields("validating object", func(e onelog.Entry) {
    e.String("name", gjson.GetBytes(payload, "request.object.metadata.name").String())
    e.String("namespace", gjson.GetBytes(payload, "request.object.metadata.namespace").String())
})

Or, with info level:

logger.InfoWithFields("validating object", func(e onelog.Entry) {
    e.String("name", gjson.GetBytes(payload, "request.object.metadata.name").String())
    e.String("namespace", gjson.GetBytes(payload, "request.object.metadata.namespace").String())
})

What happens under the covers is that our Go SDK sends every log event to the kubewarden host through waPC.

Rust

Let’s use the Rust policy template as our guide.

Our Rust SDK implements an integration with the slog crate. This crate exposes the concept of drains, so we have to define a global drain that we will use throughout our policy code:

use kubewarden::logging;
use slog::{o, Logger};
lazy_static! {
    static ref LOG_DRAIN: Logger = Logger::root(
        logging::KubewardenDrain::new(),
        o!("some-key" => "some-value") // This key value will be shared by all logging events that use
                                       // this logger
    );
}

Then, we can use the macros provided by slog to log on to different levels:

use slog::{crit, debug, error, info, trace, warn};

Let’s log an info-level message:

info!(
    LOG_DRAIN,
    "rejecting resource";
    "resource_name" => &resource_name
);

As with the Go SDK implementation, our Rust implementation of the slog drain sends this logging events to the host by using waPC.

You can read more about slog here.

Swift

We will be looking at the Swift policy template for this example.

As happens with Go and Rust’s SDKs, the Swift SDK is instrumented to use Swift’s LogHandler from the swift-log project, so our policy only has to initialize it. In our Sources/Policy/main.swift file:

import kubewardenSdk
import Logging

LoggingSystem.bootstrap(PolicyLogHandler.init)

Then, in our policy business logic, under Sources/BusinessLogic/validate.swift we can log with different levels:

import Logging

public func validate(payload: String) -> String {
    // ...

    logger.info("validating object",
        metadata: [
            "some-key": "some-value",
        ])

    // ...
}

Following the same strategy as the Go and Rust SDKs, the Swift SDK can push log events to the host through waPC.

For Cluster Administrators

Being able to log from within a policy is half of the story. Then, we have to be able to read and potentially collect these logs.

As we have seen, Kubewarden policies support structured logging that is then forwarded to the component running the policy. Usually, this is kwctl if you are executing the policy in a manual fashion, or policy-server if the policy is running in a Kubernetes environment.

Both kwctl and policy-server use the tracing crate to produce log events, either the events produced by the application itself or by policies running in WebAssembly runtime environments.

kwctl

The kwctl CLI tool takes a very straightforward approach to logging from policies: it will print them to the standard error file descriptor.

policy-server

The policy-server supports different log formatsjsontext and otlp.

otlp? I hear you ask. It stands for OpenTelemetry Protocol. We will look into that in a bit.

If the policy-server is run with the --log-fmt argument set to json or text, the output will be printed to the standard error file descriptor in JSON or plain text formats. These messages can be read using kubectl logs <policy-server-pod>.

If --log-fmt is set to otlp, the policy-server will use OpenTelemetry to report logs and traces.

OpenTelemetry

Kubewarden is instrumented with OpenTelemetry, so it’s possible for the policy-server to send trace events to an OpenTelemetry collector by using the OpenTelemetry Protocol (otlp).

Our official Kubewarden Helm Chart has certain values that allow you to deploy Kubewarden with OpenTelemetry support, reporting logs and traces to, for example, a Jaeger instance:

telemetry:
  enabled: True
  tracing:
    jaeger:
      endpoint: "all-in-one-collector.jaeger.svc.cluster.local:14250"

This functionality closes the gap on logging/tracing, given the freedom that the OpenTelemetry collector provides to us regarding flexibility of what to do with these logs and traces.

You can read more about Kubewarden’s integration with OpenTelemetry in our documentation.

But this is a big enough topic on its own and worth a future blog post. Stay logged!

Tags: ,, Category: Kubernetes Comments closed