An Introduction to SUSE Manager for Retail

Tuesday, 10 November, 2020

SUSE Manager for Retail is an open source infrastructure management solution that is optimized and tailored for the retail industry.

You can use SUSE Manager for Retail to deploy and manage point-of-service terminals, kiosks, self-service systems, and reverse-vending systems, as well as other Linux-based assets within your infrastructure. SUSE Manager for Retail provides a single user interface for handling tasks such as :

  • Creating Linux client images that are optimized for retail applications, including support for secure payments protocols
  • Deploying system images in a wide range of retail scenarios, from remote provisioning to broadband connections, to fully offline installation with physical media
  • Keeping legacy retail hardware in operation even when the system resources are too limited to support other operating systems
  • Automatically updating or patching all retail terminals from one central location
  • Monitoring the health of your entire retail environment
  • Detecting non-compliant systems or unauthorized changes to systems within the retail environment

SUSE Manager for Retail can reduce costs, streamline operations, increase flexibility, enhance reliability, and improve uptime for the complete lifecycle of your retail infrastructure.

System Architecture

At the core of the SUSE Manager for Retail environment is Linux – a secure and stable open source operating system used by thousands of large organizations for mission-critical tasks. Linux is designed to keep kernel and user processes strongly separated, which leads to stability and a natural resistance to intrusion and malware.

Linux is also very easy to mold and modify for specialized use. SUSE Linux Enterprise Point of Service (SLEPOS) is a Linux-based, point-of-service client designed to serve as a retail client within the SUSE Manager for Retail environment. SLEPOS is engineered to achieve tight security with minimal footprint and maximum security and performance.  SLEPOS uses the versatile SUSE Linux Enterprise operating system as a base platform. The default version of SLEPOS integrates several retail-specific services and standards, such as Payment Card Industry (PCI) Data Security, with world-class open source security tools for VPN, secure shell, firewall, and more. Because SLEPOS is Linux, you can add additional applications as needed, build custom applications, or create a custom system image to automate installation for a large number of devices. You can install SLEPOS on a dedicated POS device or on any standard PC. Minimal SLEPOS images require as little as 512 MB of RAM, which means SLEPOS can extend the life of older point-of-service (POS) systems.

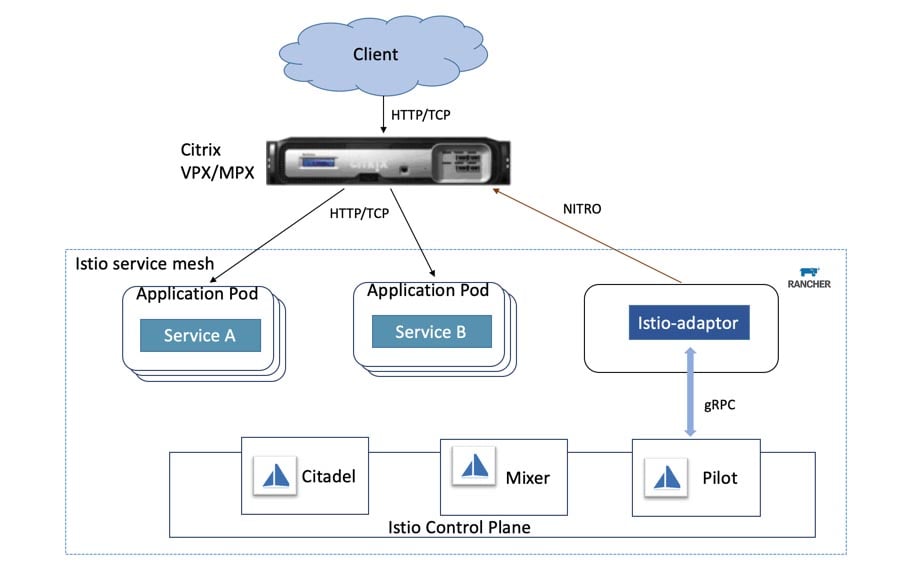
The architecture of a typical SUSE Manager for Retail network is shown in the figure. The retail devices are organized into branches. Each branch represents a local office or retail outlet at a single location.

The environment consists of:

  • SLEPOS retail client systems
  • A SUSE Manager for Retail branch server (operating at each branch location, datacentre, or cloud)
  • A SUSE Manager server to deploy and oversee the complete environment
  • Note: It is not mandatory to have a branch server is every branch, the SUSE Manager for retail architecture allows branch server to be deployed wherever optimally suited, based typically on a cost/performance requirements criteria.

Also shown in the figure are the Customer Center, an online service that helps you manage subscriptions and offers an interface with SUSE support resources, and the Subscription Management tool, a proxy system for the SUSE Customer Center with repository and registration targets.

The complete infrastructure shown in the figure could be as small as a single local shop, or it could consist of thousands of POS systems in multiple remote locations.

The SUSE Manager server lets an administrator operating from the main office view the status and proactively monitor any POS system on the network. The administrator can provision new systems, control software updates, and monitor all systems for compliance with security standards. All the systems shown in the figure are open source, which means you’ll never suffer from the vendor lock-in associated with proprietary software systems.


SUSE Manager Server

The SUSE Manager Server, which usually runs in the main office behind a firewall, is at the center of the SUSE retail management infrastructure. The SUSE Manager server controls the creation of client images, software distribution to the terminals, update procedures, and compliance checks.

The SUSE Manager server is a component of the main SUSE Manager product used for managing Linux systems in enterprise environments. For the retail edition, SUSE adds functions and extensions needed for managing retail branch servers and clients.

The upstream project for SUSE Manager, called Uyuni, is publicly developed on GitHub, with frequent releases and solid, automated testing. Although Uyuni is not commercially supported by SUSE and does not receive the same rigid QA and product lifecycle guarantees, it is a full version of the software. Unlike other vendors, whose commercial products heavily rely on extra features not available in the basic, open source version, SUSE keeps the full feature set available in the community edition.

Branch Server

The branch server of a SUSE Manager for Retail installation controlling all the retail terminals within a defined branch environment. The SUSE Manager for Retail branch server is a technical equivalent of the standard SUSE Manager Proxy Server, with enhanced functionality for the retail environment.  The branch server acts as a multipurpose server system and you can use the branch server to manage PXE remote boot for POS clients, as well as to provide DHCP, DNS, FTP, and other services for the branch. The branch server can also act as an image cache, Salt broker, and proxy server for remote package updates.

Maintaining a branch server at the local level many be beneficial for larger stores lowers the overall bandwidth needs of the retail IT network (which may very well be scattered across hundreds or thousands of kilometers), lightens the processing load on the SUSE Manager server, and generally speeds up operations.

The branch server:

  • manages the synchronized distribution of terminal system images and software updates to all the retail terminals in the same store environment
  • provides the network boot and system management infrastructure for retail terminals
  • serves as a generic system platform for in-store applications, such as database systems and as a back end for POS applications

Powerful Image Building for Retail Terminals

Daily operations in modern retail stores might appear to be a pretty small set of standard procedures. IT managers of those stores, however, know all too well that reality is often very different. Corporate acquisitions or changing hardware suppliers may result in an assortment of different terminals that require different hardware drivers or boot procedures. Suburban stores with bad internet connectivity may need different software update procedures from those in large urban centers. International companies might need different software localizations and different payment systems for different locations.

System administrators of retail chains often have to install many different software images in the terminals on their network. SUSE Manager for Retail makes it easy to customize and adapt system images.

The SUSE Manager server sets up an instance of the open source KIWI image builder. You can uses Kiwi to create software images for POS clients and other Linux systems. KIWI lets you create as many image templates as you need to handle standard configurations, then customize the images as necessary to accommodate local conditions or specific design requirements. SUSE Manager for Retail augments KIWI with an easy-to-use interface for centralized management and administration of POS images. SUSE Manager for Retail also ships with a collection of pre-configured image templates.

User Interfaces

The Web-based user interface of SUSE Manager for Retail enables users to move easily among all tasks while keeping a clear view of network resources. A sidebar menu gives constant access to all the high-level functions and components of your network, and it is possible to see the network itself with clusters of stores grouped and connected as they actually are.

You can also access a context-sensitive legend for the symbols used by SUSE Manager, breadcrumb navigation, buttons to quickly go back to the top of each window, and a dedicated search box for the menu sidebar.

Once you have completed the initial configuration, the System Set Manager (SSM) provides an efficient way to administer many systems simultaneously. After you have selected the systems on which you want to work, the main SSM window gives you quick access, through one set of tabs, to all the controls you need to apply configuration states, schedule patch updates, group or migrate systems, and much more.

For those who prefer to work without the web interface, the server command-line tool “spacecmd” offers access to all of the functions of SUSE Manager through a terminal window and supports scripting.

Flexible, Scalable, and Efficient

The flexible and efficient SUSE Manager for Retail adapts easily to your needs. Whether you manage a small shop with five POS terminals or a large chain with a thousand branches, SUSE Manager for Retail will help you configure, administer, and expand your infrastructure as your business grows and changes.

You can manage different departments or companies within the same infrastructure – each with different IT requirements. The main administrator can delegate different tasks to different users; you can subdivide the network and provide separate administrators for each subgroup. Or you can give different admins responsibility for different tasks, such as key activation, images, configuration, and software channels.

SUSE Manager for Retail lets you automate rollout for new branch servers or retail clients using the Salt configuration management system (see the box entitled “About Salt”). The SUSE Manager for Retail web interface lets administrators without advanced scripting skills specify complex system configurations using Salt Formulas  and Actions Chains.

SUSE Manager for Retails also lets you manage software updates across the infrastructure in a secure and systematic way.

You can configure a software channel for each device type or use case and automate updates through the channel, ensuring that no device receives software from an unauthorized source.

And SUSE Manager for Retail is not limited to managing devices for retail operations. You can use SUSE Manager for Retail to manage your entire Linux infrastructure, from point-of-sale terminals, to servers, to Linux workstations.

About Salt

SUSE Manager for Retail controls all its branch servers and retail terminals by means of the powerful Salt configuration management system. Salt lets you define a complete configuration for a client system in a descriptive format. A client agent, known as a Salt “minion,” can obtain this information from the Salt master without the need for additional configuration. If the client cannot run an agent, Salt is capable of acting in “agentless” mode, sending Salt-equivalent commands through an SSH connection. The ability to operate in agent or agentless mode is an important benefit for a diverse retail network.

The web interface of SUSE Manager for Retail lets the administrator create Salt Formulas and Action Chains through simple web forms. Salt Formulas are collections of Salt state files that can describe complex system configurations using parameters that make them reusable for similar but not identical systems. Action chains are sequences of Salt instructions that are executable as if they were a single command. Examples of chainable actions include rebooting the system (even in the middle of a series of configuration steps!), installing or updating software packages, and building system images.

Compliance

SUSE Manager for Retail includes tools for managing compliance with internal company policies as well as external regulations. Use SUSE Manager for Retail to create an inventory of all the systems you wish to manage. Once that inventory is available, SUSE Manager for Retail continuously monitors all its clients and reports on any deviation from current patch level or any other compliance requirement.

SUSE Manager for Retail also supports automatic, system-wide configuration of vulnerability scans, using either CVE (Comm

on Vulnerabilities and Exposures) lists or the OpenSCAP framework. You can search for CVE numbers in all patches released by SUSE, or generate custom reports of all the machines affected by a specific CVE. You can view the status of all of your Linux-based POSes and other assets in any moment and quickly identify the ones that need attention. This feature makes it possible to quickly detect “shadow IT” systems installed or reconfigured without central authorization.

New to SUSE Manager Retail 4.1

Improved operational efficiency with new capabilities focused on supporting small store operations, enhanced offline capabilities and image management over Wi-Fi.

1) Most large retailers have diverse store footprints. These may be large stores with hundreds of Point of Service (POS) devices but also smaller branches with only a few. Prior versions of SUSE Manager for Retail required a branch server to be present in each store which increased the cost and complexity of setup for certain environments. With SUSE Manager for Retail 4.1 we introduce the support for small branch operations where the branch server can run remotely in the datacentre or in the cloud. With this you can manage multiple small stores without having to deploy a branch server in each of those stores. From small to very large setups, this reduces complexity of the store infrastructure and lowers cost by reducing unnecessary hardware.

2) When you open new stores, POS devices may be deployed before any network is available at the location. In order to get the new store operational quickly, the POS terminals need to be brought up without the initial network boot cycle. SUSE Manager for Retail 4.1 provides the ability to create an image for the USB as well as for an OEM preload, allowing you to boot the terminal from the USB without having network connectivity upfront at the store.

3) Many stores today only use wireless networking. Adding wired networking in those stores for managing their POS devices would lead to increased costs and complexity. So, being able to manage the deployment and maintenance of POS terminals over the store’s Wi-Fi removes the costs associated with physical networking. Now you have the support for USB boot images, registers can easily be set up and locally booted using Wi-Fi and a USB stick. This provides greater business agility by allowing wireless “holiday registers” to be quickly deployed to meet seasonal demands in store.

Enhanced virtual machine management and monitoring capabilities, enabling fully-integrated store management.

1) A major challenge you may face as a retailer is that store locations are typically geographically distributed with no dedicated IT staff available. In this case server virtualization plays a key role in modernizing a distributed store infrastructure and helps improve operations. With virtualization retail environments can benefit from agility, availability and standardization.

2) In order to stay ahead of the competition and provide the best shopping experience to their customers, retailers need to be able to deploy new applications to the stores quickly and efficiently. The enhanced virtual machine management features of SUSE Manager for Retail 4.1 deliver performance, management and availability improvements to the store operations.

3) SUSE Manager for Retail 4.1 expands the new Prometheus/Grafana-based monitoring stack introduced with version SUSE Manager 4 with enhanced support for large federated and non-routable network environments, ideal for monitoring highly distributed retail environments. Retailers are not only able to monitor their branch servers in the stores but also their store POS devices. This allows the branches to collect metrics from the stores and send to a central aggregator that provides retailers with a centralized view of the health of their stores.

Scale Retail environments without compromise with performance and scalability enhancements.

1) With the increasing prevalence of kiosks, self-checkout devices, IoT devices and digital signage in the stores, your retail environment has probably become very large. With our performance and scalability enhancements, SUSE Manager for Retail can now scale to tens of thousands of end point devices and beyond. This allows you the flexibility to grow your infrastructure as required by your business needs, with the assurance that SUSE Manager for Retail will be able to manage large retail estates.

2) With the “SUSE Manager Hub – Tech Preview” multiserver architecture we’re gradually introducing a framework that allows for scaling retail deployments to the hundreds of thousands of nodes with tiered management servers.

Modernize your Point of Service environment while ensuring reliability and stability with SUSE Linux Enterprise Point-of-Service 15 SP2.

SUSE Manager for Retail 4.1 now provides you will predefined configuration templates to help you build SLES 15 SP2 based POS images. With SUSE Manager for Retail’s automated process, you can easily build and deploy these images on POS hardware in the store. Deploying SLEPOS 15 SP2 images in the POS environment enables retailers to bring new hardware and services into the stores, as well as gain stability for your business critical POS infrastructure with a 7.5 years long-term support for this service pack.

How can SUSE Manager for Retail help me in these unprecedented times?

During these uncertain and unprecedented times IT staff volatility has highlighted that when serious IT staff disruption occurs, home grown tools, disparate management products, remote management issues, lack of automation, and inconsistent monitoring and health checks leave IT seriously compromised. A fully leveraged SUSE Manager solution addresses ALL of the above and much more keeping your servers, VMs, containers and clusters secure, healthy, compliant and low maintenance irrespective of where they are deployed Private, Public or Hybrid cloud.

Conclusion

SUSE Manager for Retail is a fully open source solution, optimized and tailored for controlling the whole lifecycle of retail clients from one interface. Administrators can automatically provision, configure, update, and monitor every Linux client from centrally managed software sources. SUSE Manager for Retail also lets you create pre-configured client configurations and customize them as necessary for flexible and efficient rollout of new systems.

SUSE Manager for Retail will help you improve the uptime, compliance, and quality of service levels for your retail infrastructure, while preventing lock-in and reducing total cost of ownership.

And SUSE Manager for Retail is not limited to point-of-service retail environments: you can also manage your other Linux assets within the same convenient user interface.

To learn more about SUSE Manager

For detailed product specifications and system requirements, please visit: suse.com/products/suse-manager-retail/

For Uyuni details and development, visit www.uyuni-project.org

Monitor Distributed Microservices with AppDynamics and Rancher

Friday, 6 November, 2020
Discover what’s new in Rancher 2.5

Kubernetes is increasingly becoming a uniform standard for computing – in Edge, in core and in the cloud. At NTS, we recognize this trend and have been systematically building up competencies for this core technology since 2018. As a technically-oriented business, we regularly validate different Kubernetes platforms and we share the view of many analysts (e.g. Forrester or Gartner and Gartner Hype Cycle Reports) that Rancher Labs ranks among the leading players in this sector. In fact, five of our employees are Rancher certified through Rancher Academy, to maintain a close and sustainable partnership – with the best possible customer support entirely based on the premise “Relax, we care.”

Application Performance Monitoring with AppDynamics

Kubernetes is the ideal platform to create platforms and to operate a modern infrastructure. But often, Kubernetes alone is not sufficient. Understanding the application and its requirements is necessary above all – and that’s where our partnership with Rancher comes in.

The conversion to a container-based landscape carries a risk that can be minimized with comprehensive monitoring, which includes not only the infrastructure, such as vCenter, server, storage or Load Balancer, but also the business process.

To serve this sector, we have developed competencies in the area of Application Performance Monitoring (APM) and partnered with AppDynamics. Once again, we agree with analysts such as Gartner that AppDynamics is a leader in this space. We’ve achieved AppDynamics Pioneer partner status in a short amount of time thanks to our certified engineers.

Why Monitor Kubernetes with AppDynamics?

In distributed environments, it’s easy to lose track of things using containers (they do even need to be microservices). Maintaining an overview is not a simple task, but it is absolutely necessary.

We’re seeing a huge proliferation of containers. Previously there were a few “large rocks” – the virtual machines (VMs). These large rocks are the monoliths from conventional applications. In containerized environments, fundamental topics change as well. In a monolith, “process calls” within an application happen in the same VM, within the same application. With containers, they happen via networks and APIs or Service Meshes.

An optimally instrumented APM is absolutely necessary for the operation of critical applications, which are a direct contributor to the added value of a company and to the business process.

To address this need, NTS created an integration between AppDynamics and Rancher Labs. Our goal for the integration was to maintain an overview as well and to minimize the potential risk for the user/customer. In this blog post, we’ll describe the integration and show you how it works.

Integration Description

AppDynamics supports “full stack” monitoring from the application to the infrastructure. Rancher provides a modern platform for Kubernetes “everywhere” (edge, core, cloud). We have designed a tool to simplify monitoring of Kubernetes clusters and created a Rancher chart that is based on a Helm (a package manager for Kubernetes) that is available to all Rancher users in the App Catalog.

Image 01

Now we’ll show how simple it is to monitor Rancher Kubernetes clusters with AppDynamics.

Prerequisites

  • Rancher management server (Rancher)
  • Kubernetes cluster with version > = 1.13
    • On premises (e.g. based on VMware vSphere)
    • or in the public cloud (e.g. based on Microsoft Azure AKS)
  • AppDynamics controller/account (free trial available)

Deploying AppDynamics Cluster Agents

The AppDynamics cluster agent for Kubernetes is a Docker image that is maintained by AppDynamics. The deployment of the cluster agents is largely simplified and automated by our Rancher chart. Therefore, virtually any number of Kubernetes clusters can be prepared for monitoring with AppDynamics at the touch of a button. This is an essential advantage in case of distributed applications.

We conducted our deployment in an NTS Rancher test environment. To begin, we log into the Rancher Web interface:

Image 02

Next, we choose Apps in in the top navigation bar:

Image 03

Then we click Launch:

Image 04

Now, Rancher shows us the available applications. We choose appdynamics-cluster-agent:

Image 05

Next, we deploy the AppDynamics cluster agent:

Image 06

Next, choose the target Kubernetes cluster – in our case, it’s “netapp-trident.”

Image 07

Then specify the details of the AppDynamics controller:

Image 08

You can also set agent parameters via the Rancher chart.

Image 09

Finally, click Launch

Image 10

and Rancher will install the AppDynamics cluster agent in the target clusters:

Image 11

After a few minutes, we’ll see a successful deployment:

Image 12

Instrumentation of the AppDynamics Cluster Agent

After a few minutes, the deployed cluster agent shows up in the AppDynamics controller. To find it, select AdminAppDynamics AgentsCluster Agents:

Image 13

Now we “instrument” this agent (“to instrument” is the term for monitoring elements in AppD).
Choose your cluster and click Configure:

Image 14

Next, select the namespaces to monitor:

Image 15

And click Ok.

Now we’ve successfully instrumented the cluster agent.

After a few minutes (monitoring cycles), the cluster can be monitored in AppDynamics under ServersCluster:

Image 16

Kubernetes Monitoring with AppDynamics

The following screen shots show the monitoring features of AppDynamics.

Image 17
Dashboard

Image 18
Pods

Image 19
Inventory

Image 20
Events

Conclusion

In this blog post, we’ve described the integration that NTS developed between Rancher and AppDynamics. Both partners have deployed this integration and plans are for it to continue. We’ve shown you how the integration works and described how AppDynamics, which is ideally suited for monitoring Kubernetes clusters, works so well with Rancher, which is great for managing your Kubernetes deployments. NTS offers expertise and know-how in the areas of Kubernetes and monitoring and we’re excited about the potential of these platforms working together to make Kubernetes easier to monitor and manage.

Discover what’s new in Rancher 2.5

Rancher 2.5 Keeps Customers Free from Kubernetes Lock-in

Wednesday, 21 October, 2020
Discover what’s new in Rancher 2.5

Rancher Labs has launched its much-anticipated Rancher version 2.5 into the cloud-native space, and we at LSD couldn’t be more excited. Before highlighting some of the new features, here is some context as to how we think Rancher is innovating.

Kubernetes has become one of the most important technologies adopted by companies in their quest to modernize. While the container orchestrator, a fundamental piece of the cloud-native journey, has many advantages, it can also be frustratingly complex and challenging to architect, build, manage and maintain. One of the considerations is the deployment architecture, which leads many companies to want to deploy a hybrid cloud solution often due to cost, redundancy and latency reasons. This is often on premises and multi cloud.

All of the cloud providers have created Kubernetes-based solutions — such as EKS on AWS, AKS on Azure and GKE on Google Cloud. Now businesses can adopt Kubernetes at a much faster rate with less effort, compared to their technical teams building Kubernetes internally. This sounds like a great solution — except for perhaps the reasons above: cost, redundancy and latency. Furthermore, we have noticed a trend of no longer being cloud native, but AWS native or Azure native. The tools and capabilities are vastly different from cloud to cloud, and they tend to create their own kind of lock-in.

The cloud has opened so many possibilities, and the ability to add a credit card and within minutes start testing your idea is fantastic. You don’t have to submit a request to IT or wait weeks for simple infrastructure. This has led to the rise of shadow IT, with many organizations bypassing the standards set out to protect the business.

We believe the new Rancher 2.5 release addresses both the needs for standards and security across a hybrid environment while enabling efficiency in just getting the job done.

Rancher has also released K3s, a highly available certified Kubernetes distribution designed for the edge. It supports production workloads in unattended, resource-constrained remote locations or inside IoT appliances.

Enter Rancher 2.5: Manage Kubernetes at Scale

Rancher enables organizations to manage Kubernetes at scale, whether on-premise or in the cloud, through a single pane of glass, providing for a consistent experience regardless of where your operations are happening. It also enables you to import existing Kubernetes clusters and centrally manage. Rancher has taken Kubernetes and beefed it up with the required components to make it a fantastic enterprise-grade container platform. These components include push-button platform upgrades, SDLC pipeline tooling, monitoring and logging, visualizing Kubernetes resources, service mesh, central authorization, RBAC and much more.

As good as that sounds, what is the value in unifying everything under a platform like Rancher? Right off the bat there are three obvious benefits:

  • Consistently deliver a high level of reliability on any infrastructure
  • Improve DevOps efficiency with standardized automation
  • Ensure enforcement of security policies on any infrastructure

Essentially, it means you don’t have to manage each Kubernetes cluster independently. You have a central point of visibility across all clusters and an easier time with security policies across the different platforms.

Get More Value out of Amazon EKS

With the release of Rancher 2.5, enhancements enhanced of the EKS platform support means that you can now derive even more value from your existing EKS clusters, including the following features:

  • Enhanced EKS cluster import, keeping your existing cluster intact. Simply import it and let Rancher start managing your clusters, enabling all the benefits of Rancher.
  • New enhanced configuration of the underlying infrastructure for Rancher 2.5, making it much simpler to manage.
  • New Rancher cluster-level UX explores all available Kubernetes resources
  • From an observability perspective, Rancher 2.5 comes with enhanced support for Prometheus (for monitoring) and Fluentd/Fluentbit (for logging)
  • Istio is a service mesh that lets you connect, secure, control and observe services. It controls the flow of traffic and API calls between services and adds a layer of security through managed authentication and encryption. Rancher now fully supports Istio.
  • A constant risk highlighted with containers is security. Rancher 2.5 now includes CIS Scanning of container images. It also includes an OPA Gatekeeper (open policy agent) to describe and enforce policies. Every organization has policies; some are essential to meet governance and legal requirements, while others help ensure adherence to best practices and institutional conventions. Gatekeeper lets you automate policy enforcement to ensure consistency and allows your developers to operate independently without having to worry about compliance.

Conclusion

In our opinion, Rancher has done a spectacular job with the new additions in 2.5 by addressing critical areas that are important to customers. They have also shown that you absolutely can get the best of both EKS and fully-supported features.

LSD was founded in 2001 and wants to inspire the world by embracing open philosophy and technology, empowering people to be their authentic best selves, all while having fun. Specializing in containers and cloud native, the company aims to digitally accelerate clients through a framework called the LSDTrip. To learn more about the LSDTrip, visit us or email us.

Discover what’s new in Rancher 2.5

New Zealand’s Wellington Institute of Technology students build Ceph proof of concept with help from SUSE

Wednesday, 21 October, 2020

A team of students at the Wellington Institute of Technology (WelTec) is developing a proof of concept that involves implementing a software defined storage solution for campus-wide staff and student use. WeITec is one of New Zealand’s oldest tertiary education institutions that trains over 6,000 students each year. They offer degree programmes that are future-focused, developed alongside industry and provide students with practical real-world skills.

The proof of concept project came about as WeITec staff and students were handling virtual machines (VMs) stored on local drives in each individual Windows client-based PC which required users to copy their VM from one PC to another across the network if they choose to work at a different station. In order to overcome this inundated task, the team at WeITec chose Ceph as their vendor and has been impressed with its technical capabilities. Ceph is a highly-resilient software defined storage offering which has only been available to Microsoft Windows environments through the use of iSCSI or CIFS gateways. You can read more about this storage offering from the SUSE community here.

The challenge these students faced was getting a Ceph cluster running that supports their initial ambition, i.e. cross-network storage for staff and student use. They were making good progress building their own WNBD and Dokany drivers but found compiling for Ceph-Windows presented obstacles.  SUSE and Cloudbase published the Ceph for Windows installer last month which proved critical to the project’s success. Now the students’ test environment is running with several Windows clients using the SUSE/Cloudbase built solution!

WelTec student and technical lead, Jesse Beaty-Ward, says “The SUSE/Cloudbase installer solution gave us the capability to deliver Ceph block devices to our Windows 10 clients as we had imagined. We could monitor cluster usage while accessing those block devices, format, read and write to them like any other device.”

“We were very pleased to hear of the students’ challenges and success in carrying out this project.  The capstone project that our senior IT students undertake is a chance to apply the learning they have had throughout their studies with us to an authentic problem and to come up with creative solutions. This project has allowed the team the opportunity to explore problem-solving in their own development as well as, thanks to SUSE and Cloudbase, experience a successful integration of available solutions into their work.  These students will take this learning with them as they move into the industry and be better prepared for the technical challenges that come their way,” said Mary-Claire Proctor, WelTec Head of School of Business and Information Technology.

It’s great to see a successful, self-guided academic endeavour led by a group of independent students who has built a Ceph proof of concept environment. The tangible outcomes from this project offer a potentially viable storage solution for their campus, but the experience gained from an education perspective is invaluable. The team is already planning to build another cluster using openSUSE and would like to benchmark the two clusters to see if varying distributions has any effect on performance. Thank you, Jesse Beaty-Ward, William Edmeades and Vincent Cherry, (Project Team Alpha) from WeITec for sharing your experience with SUSE. We are excited to follow the team’s journey and continue to work with the group to encourage new innovations.

Over recent years, SUSE has played a role in helping support students learn and build on open source technology, through various OpenSUSE projects, educational partnerships and the Academic Program. Our aim is to continue to inspire and use “The Power of Education” to help bridge the technology skills gap, build community and reach a far broader audience of learners.


[Blog Author: Brendan Bulmer, Global Academic Program Manager at SUSE]

RGW metadata Search with Elasticsearch

Saturday, 10 October, 2020

(This blog is wrtiten by Xidian Chen)

1.    Understand data organization and storage

An object is the basic unit of data organization and storage in an object storage system. An object contains information that should be composed of metadata of data entities, data entities and user-defined metadata of data entities.


  • Data refers to the real data maintained by the user, such as the content of a text file or a video file
  • The basic and necessary meta-information in the data entity includes: which storage space belongs to, type, size, check value, last modification time, and other information to be saved except the data, which is generally composed of KV key-value pair
  • For some businesses, more meta-information may be required. For example, a video file, in addition to the type, size, checksum, last modification time, the user’s business may also want additional traces, such as video style, lead actor, etc.
  • Key: The Key value, namely the name of the object, is the character sequence with utF-8 encoding length greater than 0 and no more than 1024. Each object in a bucket must have a unique object key value

2.    Metadata Search

Plan 1

The architecture of this scheme is straightforward. The front-end application uploads the object to the Ceph RGW and sends the custom metadata of this object to the ElasticSearch cluster. When a user needs to get an object, a search request can be sent to ElasticSearch to get the object address. This request can be an object name or an object ID number, or a user-defined metadata. Once ElasticSearch returns the address of this object, the front-end application USES this address to obtain the object itself directly from the Ceph RGW.

It is not difficult to see the implementation process of the scheme. The idea of this scheme is relatively straightforward and its implementation is not difficult, but the data consistency between RGW and ElasticSearch completely depends on the front-end application. In addition to SDK, S3 has s3CMD, a command-line tool. RGW can also upload objects via HTTP request. Imagine that users can upload objects directly in the background rather than through the front-end application, which creates ElasticSearch which cannot synchronize corresponding metadata.

Plan 2

Since Ceph has added support for ElasticSearch after the Jewel release, we can achieve automatic synchronization of RGW metadata into ElasticSearch by defining new zone types and synchronization plug-ins. In this way, the consistency of RGW and ElasticSearch data is guaranteed, greatly reducing the coupling between front and rear ends.


As can be seen from the architecture diagram, the only difference between Plan 1 and Plan 2 is that there is no need to upload metadata to ElasticSearch when the front-end uploads objects. The built-in Sync Plugin in the Ceph RGW can automatically synchronize metadata to ElasticSearch.

Final Plan

To achieve ElasticSearch for RGW metadata synchronization, we configured a ZoneGroup (CN) and added two zones: US-1 (master) and US-2 (Slave). In addition, an RGW instance is started on each zone respectively. Rgw.us-1 is used to accept read and write requests from the front end, and RGW.US-2 is used to synchronize metadata to ElasticSearch.

3.    Demo

Env

  • Architecture

  • ES Cluster
Host Name Public Network Admin Network
es-node001 192.168.2.101 172.200.50.101
es-node002 192.168.2.102 172.200.50.102
es-node003 192.168.2.103 172.200.50.103
  • Ceph Cluster
Host Name  Public Network Admin Network Cluster Network
admin 192.168.2.39  172.200.50.39  192.168.3.39
node001 192.168.2.40  172.200.50.40  192.168.3.40
node002 192.168.2.41  172.200.50.41  192.168.3.41

Deploy ES Cluster

  • Install JDK and ES packages, all nodes

# zypper -n in java-1_8_0-openjdk 
# zypper -n in java-1_8_0-openjdk-devel
# zypper –no-gpg-checks -n in elasticsearch-5.6.0.rpm


  • Configure ES
  • es-node001

# cat /etc/elasticsearch/elasticsearch.yml | grep -v ^#
cluster.name: my-application
node.name: es-node001
network.host: 0.0.0.0
http.port: 9200
discovery.zen.ping.unicast.hosts: [“es-node001”, “es-node002″,”es-node003”]


  • es-node002

# cat /etc/elasticsearch/elasticsearch.yml | grep -v ^# | grep -v ^$
cluster.name: my-application
node.name: es-node002
network.host: 0.0.0.0
http.port: 9200
discovery.zen.ping.unicast.hosts: [“es-node001”, “es-node002″,”es-node003”]


  • es-node003

# cat /etc/elasticsearch/elasticsearch.yml | grep -v ^# | grep -v ^$
cluster.name: my-application
node.name: es-node003
network.host: 0.0.0.0
http.port: 9200
discovery.zen.ping.unicast.hosts: [“es-node001”, “es-node002″,”es-node003”]


  • Enable Service

# systemctl daemon-reload
# systemctl enable elasticsearch.service
# systemctl start elasticsearch.service
# systemctl status elasticsearch.service


  • Check port and network

# netstat -ntulp
Active Internet connections (only servers)
Proto Recv-Q Send-Q Local Address Foreign Address State PID/Program name
tcp 0 0 0.0.0.0:22 0.0.0.0:* LISTEN 1670/sshd
tcp6 0 0 :::9200 :::* LISTEN 14082/java
tcp6 0 0 :::9300 :::* LISTEN 14082/java
tcp6 0 0 :::22 :::* LISTEN 1670/sshd


  • Check ES Cluster
  • ES Cluster Version

# curl 192.168.2.101:9200
{
“name” : “5JyoL9w”,
“cluster_name” : “elasticsearch”,
“cluster_uuid” : “vCFofUJBR46zUmOKp_bDWA”,
“version” : {
“number” : “5.6.0”,
“build_hash” : “781a835”,
“build_date” : “2017-09-07T03:09:58.087Z”,
“build_snapshot” : false,
“lucene_version” : “6.6.0”
},
“tagline” : “You Know, for Search”
}


  • Cluster nodes info

# curl -XGET ‘172.200.50.101:9200/_cat/nodes?v’
ip heap.percent ram.percent cpu load_1m load_5m load_15m node.role master name
172.200.50.53 16 71 0 0.01 0.01 0.00 mdi – node-3
172.200.50.52 17 70 0 0.08 0.07 0.02 mdi – node-2
172.200.50.51 13 65 0 0.02 0.01 0.00 mdi * node-1


  • Status of Cluster

# curl -XGET ‘172.200.50.101:9200/_cluster/health?&pretty’
{
“cluster_name” : “my-application”,
“status” : “green”,
“timed_out” : false,
“number_of_nodes” : 3,
“number_of_data_nodes” : 3,
“active_primary_shards” : 0,
“active_shards” : 0,
“relocating_shards” : 0,
“initializing_shards” : 0,
“unassigned_shards” : 0,
“delayed_unassigned_shards” : 0,
“number_of_pending_tasks” : 0,
“number_of_in_flight_fetch” : 0,
“task_max_waiting_in_queue_millis” : 0,
“active_shards_percent_as_number” : 100.0
}


Deploy Ceph

  • realm: gold
  • zonegroup: us
  • data zone: us-east-1
  • metadata search zone: us-east-2

1、Create Master Zone

(1)Create Pool (node001)

# ceph osd pool create .rgw.root 8 8
# ceph osd pool create us-east-1.rgw.control 8 8
# ceph osd pool create us-east-1.rgw.meta 16 16
# ceph osd pool create us-east-1.rgw.log 8 8
# ceph osd pool create us-east-1.rgw.buckets.index 8 8
# ceph osd pool create us-east-1.rgw.buckets.data 64 64

# ceph osd pool application enable .rgw.root rgw
# ceph osd pool application enable us-east-1.rgw.control rgw
# ceph osd pool application enable us-east-1.rgw.meta rgw
# ceph osd pool application enable us-east-1.rgw.log rgw
# ceph osd pool application enable us-east-1.rgw.buckets.index rgw
# ceph osd pool application enable us-east-1.rgw.buckets.data rgw

# ceph osd pool create .rgw.root 8 8
# ceph osd pool create us-east-2.rgw.control 8 8
# ceph osd pool create us-east-2.rgw.meta 16 16
# ceph osd pool create us-east-2.rgw.log 8 8
# ceph osd pool create us-east-2.rgw.buckets.index 8 8
# ceph osd pool create us-east-2.rgw.buckets.data 64 64

# ceph osd pool application enable .rgw.root rgw
# ceph osd pool application enable us-east-2.rgw.control rgw
# ceph osd pool application enable us-east-2.rgw.meta rgw
# ceph osd pool application enable us-east-2.rgw.log rgw
# ceph osd pool application enable us-east-2.rgw.buckets.index rgw
# ceph osd pool application enable us-east-2.rgw.buckets.data rgw


(2)Delete Default Zone Group and Zone (Optional)

A default zone group named Default is created when the object gateway is installed with the default Settings. Since we no longer need the default locale group, we delete it

# radosgw-admin zonegroup list
{
“default_info”: “”,
“zonegroups”: [
“default” ]
}

# radosgw-admin zonegroup remove –rgw-zonegroup=default –rgwzone=default
# radosgw-admin period update –commit
# radosgw-admin zone delete –rgw-zone=default
# radosgw-admin period update –commit
# radosgw-admin zonegroup delete –rgw-zonegroup=default
# radosgw-admin period update –commit


(3)Create realm (admin)

# radosgw-admin realm create –rgw-realm=gold –default
# radosgw-admin realm list
{
“default_info”: “ded6e77f-afe6-475c-8fdb-e09f684acf18”,
“realms”: [
“gold”
]


(4)Create Master Zonegroup ( us )  (admin)

# radosgw-admin zonegroup create –rgw-zonegroup=us \
–endpoints=http://192.168.2.41:80 –master –default


# radosgw-admin zonegroup list
{
“default_info”: “6ac5588a-a0ae-44e7-9a91-6cc285e9d521”,
“zonegroups”: [
“us”
]


(5)Create Master Zone (us-east-1)

Randomly generate a key, and then use that key

# SYSTEM_ACCESS_KEY=$(cat /dev/urandom | tr -dc ‘a-zA-Z0-9’ | fold -w 20 | head -n 1)
# SYSTEM_SECRET_KEY=$(cat /dev/urandom | tr -dc ‘a-zA-Z0-9’ | fold -w 40 | head -n 1)

# SYSTEM_ACCESS_KEY=MebOITA7uiemM3UeASMn
# SYSTEM_SECRET_KEY=PIZYauzILJlMG0MylUkBwnR73hA0FQ1qb0qvOxER

# radosgw-admin zone create –rgw-zonegroup=us –rgw-zone=us-east-1 \
–endpoints=http://192.168.2.41:80 –access-key=$SYSTEM_ACCESS_KEY \
–secret=$SYSTEM_SECRET_KEY

# radosgw-admin zone list
{
“default_info”: “b7467d31-fb6b-46f5-aff2-8b6418356109”,
“zones”: [
“us-east-1”
]


(6)Delete default zone (Optional)

# radosgw-admin zone delete –rgw-zone=default


(7)Create User

# radosgw-admin user create –uid=zone.user \
–display-name=”Zone User” –access-key=$SYSTEM_ACCESS_KEY \
–secret=$SYSTEM_SECRET_KEY –system
{
“user_id”: “zone.user”,
“display_name”: “Zone User”,
“email”: “”,
“suspended”: 0,
“max_buckets”: 1000,
“subusers”: [],
“keys”: [
{
“user”: “zone.user”,
“access_key”: “MebOITA7uiemM3UeASMn”,
“secret_key”: “PIZYauzILJlMG0MylUkBwnR73hA0FQ1qb0qvOxER”
}

# radosgw-admin user list
# radosgw-admin user info –uid=zone.user


(8)Updates and Commit Period(Admin)

# radosgw-admin period update –commit
# radosgw-admin period get
{
“id”: “3f07279f-1182-47e3-9388-fc9999b3317c”,
“epoch”: 1,
“predecessor_uuid”: “b62f7c97-fa71-4a5e-9859-b4faa242ddef”,
“sync_status”: [],
“period_map”: {
“id”: “3f07279f-1182-47e3-9388-fc9999b3317c”,
“zonegroups”: [
{
“id”: “1d3b5143-f575-4f9f-91d2-9fdc62e82992”,
“name”: “us”,
“api_name”: “us”,
“is_master”: “true”,
“endpoints”: [
“http://192.168.2.41:80”
],


(9)Create node002 GW key (Admin)

# ceph auth add client.rgw.us-east-1 mon ‘allow rwx’ osd ‘allow rwx’ mgr ‘allow r’
# ceph auth get client.rgw.us-east-1 > /etc/ceph/ceph.client.us-east-1.keyring
# scp /etc/ceph/ceph.client.us-east-1.keyring node002:/etc/ceph/


(10)Start RADOS  gateway  (node002)

# zypper ref && sudo zypper in ceph-radosgw

# vim /etc/ceph/ceph.conf
[client.rgw.us-east-1]
rgw_frontends=”beast port=80″
rgw_zone=us-east-1
keyring = /etc/ceph/ceph.client.us-east-1.keyring
log file = /var/log/radosgw/rgw.us-east-1.radosgw.log

# mkdir /var/log/radosgw/

# systemctl restart ceph-radosgw@rgw.us-east-1
# systemctl enable ceph-radosgw@rgw.us-east-1
# systemctl status ceph-radosgw@rgw.us-east-1


2、Create Secondary Zone

(1)Create secondary zone:us-east-2 (Admin)

# radosgw-admin zone create –rgw-zonegroup=us –endpoints=http://192.168.2.42:80 \
–rgw-zone=us-east-2 –access-key=$SYSTEM_ACCESS_KEY \
–secret=$SYSTEM_SECRET_KEY

# radosgw-admin zone list
{
“default_info”: “57fd7201-3789-4fbd-adfa-b473614df315”,
“zones”: [
“us-east-1”,
“us-east-2”
]


(2)Update and Commit Period(Admin)

# radosgw-admin period update –commit


(3)Create rgw key (Admin)

# ceph auth add client.rgw.us-east-2 mon ‘allow rwx’ osd ‘allow rwx’ mgr ‘allow r’
# ceph auth get client.rgw.us-east-2 > /etc/ceph/ceph.client.us-east-2.keyring
# scp /etc/ceph/ceph.client.us-east-2.keyring node003:/etc/ceph/


(4)Start RADOS  gateway (node003)

# zypper ref && sudo zypper in ceph-radosgw

# vim /etc/ceph/ceph.conf
[client.rgw.us-east-2]
rgw_frontends=”beast port=80″
rgw_zone=us-east-2
keyring = /etc/ceph/ceph.client.us-east-2.keyring
log file = /var/log/radosgw/rgw.us-east-2.radosgw.log

# mkdir /var/log/radosgw/

# systemctl restart ceph-radosgw@rgw.us-east-2
# systemctl enable ceph-radosgw@rgw.us-east-2
# systemctl status ceph-radosgw@rgw.us-east-2


(5)Check sync status(Admin)

# radosgw-admin sync status
realm c859877c-22aa-41ed-bcb4-23d36d8c212f (gold)
zonegroup 1d3b5143-f575-4f9f-91d2-9fdc62e82992 (us)
zone 57fd7201-3789-4fbd-adfa-b473614df315 (us-east-1)
metadata sync no sync (zone is master)
data sync source: a8ef6d51-d8de-40a2-98cc-c92ac62fb84f (us-east-2)
syncing
full sync: 0/128 shards
incremental sync: 128/128 shards
data is caught up with source


(6)Check disk of Capacity

# ceph df
RAW STORAGE:
CLASS SIZE AVAIL USED RAW USED %RAW USED
hdd 66 GiB 48 GiB 12 GiB 18 GiB 27.44
TOTAL 66 GiB 48 GiB 12 GiB 18 GiB 27.44


(7)Modify us-east-2 Deployment ,Modify tier-type and tier-config , Point the Port of Elasticsearch.

ElasticSearch Tier Type Configuration Parameters:

  • endpoint: Specifies the ElasticSearch server endpoint to access.
  • num_shards: (integer) The number of shards that ElasticSearch will be configured with on data synchronization initialization.
  • num_replicas: (integer) The number of replicas that ElasticSearch will be configured with on data synchronization initialization.
  • explicit_custom_meta: Specifies whether all user custom metadata will be indexed or whether the user needs to configure (at the bucket level) which customer metadata items should be indexed. This parameter defaults to false

Notes:Address is ES Master IP

# radosgw-admin zone modify –rgw-zone=us-east-2 –tier-type=elasticsearch \
–tier-config=endpoint=http://192.168.2.101:9200,num_shards=5,num_replicas=1
{
“id”: “7b2733a8-cbd6-4564-a509-b9abbb86f02a”,
“name”: “us-east-2”,
“domain_root”: “us-east-2.rgw.meta:root”,
“control_pool”: “us-east-2.rgw.control”,
“gc_pool”: “us-east-2.rgw.log:gc”,
“lc_pool”: “us-east-2.rgw.log:lc”,
“log_pool”: “us-east-2.rgw.log”,
“intent_log_pool”: “us-east-2.rgw.log:intent”,
“usage_log_pool”: “us-east-2.rgw.log:usage”,
“reshard_pool”: “us-east-2.rgw.log:reshard”,
“user_keys_pool”: “us-east-2.rgw.meta:users.keys”,
“user_email_pool”: “us-east-2.rgw.meta:users.email”,
“user_swift_pool”: “us-east-2.rgw.meta:users.swift”,
“user_uid_pool”: “us-east-2.rgw.meta:users.uid”,
“otp_pool”: “us-east-2.rgw.otp”,
“system_key”: {
“access_key”: “MebOITA7uiemM3UeASMn”,
“secret_key”: “PIZYauzILJlMG0MylUkBwnR73hA0FQ1qb0qvOxER”
},
“placement_pools”: [
{
“key”: “default-placement”,
“val”: {
“index_pool”: “us-east-2.rgw.buckets.index”,
“storage_classes”: {
“STANDARD”: {
“data_pool”: “us-east-2.rgw.buckets.data”
}
},
“data_extra_pool”: “us-east-2.rgw.buckets.non-ec”,
“index_type”: 0
}
}
],
“metadata_heap”: “”,
“tier_config”: {
“endpoint”: “http://192.168.2.101:9200”,
“num_replicas”: 1,
“num_shards”: 5
},
“realm_id”: “30114dc2-6e8d-41fa-9284-35e9fe8673eb”
}


Verify with Postman

Understanding Istio and its Installation

Wednesday, 30 September, 2020

We know that almost every organisation is working to transform their application to support microservices architecture as it provides many benefits which help in their business. Microservices architectures enhance the ability for modern software teams to deliver applications at scale, but as an application’s footprint grows, the challenge is to maintain a network between services. Service meshes provide service discovery, load balancing, and authentication capabilities for microservices

This is where Istio comes into play. Istio is an open-source service mesh that lets you connect, monitor, and secure microservices deployed on-premise, in the cloud, or with orchestration platforms like Kubernetes.

What is a service mesh?

A microservices architecture isolates software functionality into multiple independent services that are independently deployable, highly maintainable and testable, and organized around specific business capabilities. These services communicate with each other through simple, universally accessible APIs. On a technical level, microservices enable continuous delivery and deployment of large, complex applications. On a higher business level, microservices help deliver speed, scalability, and flexibility to companies trying to achieve agility in rapidly evolving markets.

A service mesh is an infrastructure layer that allows your service instances to communicate with one another. The service mesh also lets you configure how your service instances perform critical actions such as service discovery, load balancing, data encryption, and authentication and authorization.

Istio Architecture

An Istio service mesh is logically split into a data plane and a control plane.

The data plane is composed of a set of intelligent proxies (Envoy) deployed as sidecars. These proxies mediate and control all network communication between microservices. They also collect and report telemetry on all mesh traffic.

The control plane manages and configures the proxies to route traffic.

The following diagram shows the different components that make up each plane:

Shape The overall architecture of an Istio-based application.

Components

The following sections provide a brief overview of each of Istio’s core components.

Envoy

Istio uses an extended version of the Envoy proxy. Envoy is a high-performance proxy to mediate all inbound and outbound traffic for all services in the service mesh. Envoy proxies are the only Istio components that interact with data plane traffic.

Envoy proxies are deployed as sidecars to services, logically augmenting the services with Envoy’s many built-in features. This sidecar deployment allows Istio to enforce policy decisions and extract rich telemetry which can be sent to monitoring systems to provide information about the behaviour of the entire mesh.

Istiod

Istiod provides service discovery, configuration and certificate management.

Istiod converts high level routing rules that control traffic behaviour into Envoy-specific configurations, and propagates them to the sidecars at runtime. Pilot abstracts platform-specific service discovery mechanisms and synthesizes them into a standard format that any sidecar conforming with the Envoy API can consume.

Installation

We will see how to install Istio on SUSE CaaSP in this section.

Download Istio from below command. It will download latest Istio version from github.

sles@mgmt:~> curl -L https://istio.io/downloadIstio | sh –

sles@mgmt:~>cd istio-1.7.2

To configure the istioctl client tool for your workstation, add the /home/sles/istio-1.7.2/bin directory to your environment path variable with:

sles@mgmt:~/istio-1.7.2> export PATH=”$PATH:/home/sles/istio-1.7.2/bin”

Begin the Istio pre-installation check by running:

sles@mgmt:~/istio-1.7.2> istioctl x precheck

Checking the cluster to make sure it is ready for Istio installation…

#1. Kubernetes-api

———————–

Can initialize the Kubernetes client.

Can query the Kubernetes API Server.

———————– Output truncated——————

Install Pre-Check passed! The cluster is ready for Istio installation.

For this installation, we use the demo configuration profile. It’s selected to have a good set of defaults for testing, but there are other profiles for production or performance testing. Please visit below link to check all configuration profiles

https://istio.io/latest/docs/setup/additional-setup/config-profiles/

sles@mgmt:~/istio-1.7.2> istioctl install –set profile=demo

Add a namespace label to instruct Istio to automatically inject Envoy sidecar proxies when you deploy your application later:

sles@mgmt:~/istio-1.7.2> kubectl label namespace default istio-injection=enabled

Deploy a sleep deployment which is under samples.

sles@mgmt:~/istio-1.7.2>kubectl apply -f samples/sleep/sleep.yaml

This will create pod, service and service account. We need to assign created service account a role which provides NET_ADMIN and NET_RAW capabilities. We will do it by creating below CLusterRoleBinding.

sles@mgmt:~/istio-1.7.2> cat >> sleep-role.yaml <<EOF
apiVersion: rbac.authorization.k8s.io/v1
kind: ClusterRoleBinding
metadata:
name: testing
roleRef:
apiGroup: rbac.authorization.k8s.io
kind: ClusterRole
name: suse:caasp:psp:privileged
subjects:
– kind: ServiceAccount
name: sleep
namespace: default
EOF

sles@mgmt:~> kubectl get pods
NAME READY STATUS RESTARTS AGE
nfs-storage-nfs-client-provisioner-789494d44c-ptzhz 1/1 Running 0 11d
sleep-8f795f47d-mjl9q 2/2 Running 0 3d23h

sles@mgmt:~> kubectl describe pod sleep-8f795f47d-mjl9q
Name: sleep-8f795f47d-mjl9q
Namespace: default
Priority: 0
Node: worker2/192.168.122.120
Start Time: Fri, 25 Sep 2020 19:34:12 +0530
Containers:
sleep:

Container ID: cri-o://0097a82b060488c88e638d550f7bddbd37fa63a8900ae13c99f646155ea64f9d
Image: governmentpaas/curl-ssl
Image ID: docker.io/governmentpaas/curl-
istio-proxy:
Container ID: cri-o://91005e03fcde4a8c35a7e6b141f7fca48ec085c35d08a0d49f614b97e8dbee28
Image: docker.io/istio/proxyv2:1.5.0
Image ID: docker.io/istio/
———————– Output truncated——————

As we can see from above output when you deploy an application after Istio is deployed and Istio-Injection is enabled on a namespace, side proxy container is getting created by default.

Istio has lots of features which makes service mesh management easier. It provides Dynamic service discovery, Load balancing, TLS termination, HTTP/2 and gRPC proxies, Circuit breakers, Health checks, Staged rollouts with %-based traffic split, Fault injection, Rich metrics, service discovery, configuration and certificate management.

Gain Better Visibility into Kubernetes Cost Allocation

Wednesday, 30 September, 2020
Join The Master Class: Kubernetes Cost Allocation and Visibility, Tuesday, October 13 at 2pm ET

The Complexity of Measuring Kubernetes Costs

Adopting Kubernetes and service-based architecture can bring many benefits to organizations – teams move faster and applications scale more easily. However, visibility into cloud costs is made more complicated with this transition. This is because applications and their resource needs are often dynamic, and teams share core resources without transparent prices attached to workloads. Additionally, organizations that realize the full benefit of Kubernetes often run resources on disparate machine types and even multiple cloud providers. In this blog post, we’ll look at best practices and different approaches for implementing cost monitoring in your organization for a showback/chargeback program, and how to empower users to act on this information. We’ll also look at Kubecost, which provides an open source approach for ensuring consistent and accurate visibility across all Kubernetes workloads.

Image 01
A common Kubernetes setup with team workloads spread across Kubernetes nodes and clusters

Let’s look further into best practices for accurately allocating and monitoring Kubernetes workload costs as well as spend on related managed services.

Cost Allocation

Accurately allocating resource costs is the first critical step to creating great cost visibility and achieving high cost efficiency within a Kubernetes environment.

To correctly do this, you need to allocate costs at the workload level, by individual container. Once workload allocation is complete, costs can be correctly assigned to teams, departments or even individual developers by aggregating different collections of workloads. One framework for allocating cost at the workload level is as follows:

Image 02

Let’s break this down a bit.

The average amount of resources consumed is measured by the Kubernetes scheduler or by the amount provisioned from a cloud provider, depending on the particular resource being measured. We recommend measuring memory and CPU allocation by the maximum of request and usage. Using this methodology reflects the amount of resources reserved by the Kubernetes scheduler itself. On the other hand, resources like load balancers and persistent volumes are strictly based on the amount provisioned from a provider.

The Kubernetes API can directly measure the period of time a resource is consumed. This is determined by the amount of time spent in a Running state for resources like memory, CPU and GPU. To have numbers that are accurate enough for cloud chargeback, we recommend that teams reconcile this data with the amount of time a particular cloud resource, such as a node, was provisioned by a cloud provider. More on this in the section below.

Resource prices are determined by observing the cost of each particular resource in your environment. For example, the price of a CPU hour on a m5.xlarge spot instance in us-east-1 AWS zone will be different than the on-demand price for that same instance.

Once costs are appropriately allocated across individual workloads with this framework, they can then be easily aggregated by any Kubernetes concept, such as namespace, label, annotation or controller.

Kubernetes Cost Monitoring

With costs allocated by Kubernetes concept (pod or controller) you can begin to accurately map spend to any internal business concept, such as team, product, department or cost center. It’s common practice for organizations to segment team workloads by Kubernetes namespace, whereas others may use concepts like Kubernetes labels or annotations to identify which team a workload belongs to.

Another key element for cost monitoring across different applications, teams, etc. is determining who should pay for idle or slack capacity. This specifically refers to unused cluster resources that are still being billed to your company. Often these are either billed to a central infrastructure cost center or distributed proportionally to application teams. Assigning these costs to the team(s) responsible for provisioning decisions has shown to have positive results by aligning the incentive to have an efficiently sized cluster.

Reconciling to Cloud Bill

Kubernetes provides a wealth of real-time data. This can be used to give developers access to immediate cost metrics. While this real-time data is often precise, it may not perfectly correspond to a cloud provider’s billing data. For example, when determining the hourly rate of an AWS spot node, users need to wait on either the Spot data feed or the Cost & Usage Report to determine exact market rates. For billing and chargeback purposes, you should reconcile data to your actual bill.

Image 03

Get Better Visibility & Governance with Kubecost

We’ve looked at how you can directly observe data to calculate the cost of Kubernetes workloads. Another option is to leverage Kubecost, a cost and capacity management solution built on open source that provides visibility across Kubernetes environments. Kubecost provides cost visibility and insights across Kubernetes workloads as well as the related managed services they consume, such as S3 or RDS. This product collects real-time data from Kubernetes and also reconciles with your cloud billing data to reflect the actual prices you have paid.

Image 04
A Kubecost screenshot showing cost by Kubernetes cost by namespace

With a solution like Kubecost in place, you can empower application engineers to make informed real-time decisions and start to implement immediate and long-term practices to optimize and govern cloud spend. This includes adopting cost optimization insights without risking performance, implementing Kubernetes budgets and alerts, showback/chargeback programs or even cost-based automation.

Kubecost community version is available for free with all of these features described – and you can find the Kubecost Helm chart in the Rancher App Catalog. Rancher gives you broad visibility and control; Kubecost gives you direct insight into spend and how to optimize. Together they provide a complete cost management story for teams using Kubernetes. To learn more about how to gain visibility into your Kubernetes costs, join our Master Class on Kubernetes Cost Allocation and Visibility, Tuesday, October 13, at 2pm ET.

Join The Master Class: Kubernetes Cost Allocation and Visibility, Tuesday, October 13 at 2pm ET

Connecting the World’s Travel Trade with Kubernetes

Monday, 21 September, 2020

“We needed the flexibility to run any technologies side-by-side and a way to run clusters in multiple clouds, and a variety of environments – depending on customer needs. Rancher was the only realistic choice.” Juan Luis Sanfélix Loshuertos, IT Operations Manager – Compute & Storage, Hotelbeds

When you book a hotel online or with a travel agent, you’ve probably got a wish list that has to do with the size of the room, view, location and amenities. It’s likely you’re not thinking about the technology in the background that makes it all happen. That’s where Hotelbeds comes in. The business-to-business travel technology company operates a hotel distribution platform that travel agents, tour operators, airlines and loyalty programs use to book hotel rooms.

As the world’s leading “bedbank”, the Spanish company provides more than 180,000 hotel properties worldwide with access to distribution channels that significantly increase occupation rates. They give hoteliers access to a network of more than 60,000 hard-to-access B2B travel buyers such as tour operators, retail travel agents, airline websites and loyalty programs.

Hotelbeds attributes much of its success to a focus on technology innovation. One of the main roles of its technology teams is to experiment and validate technologies that make the business more competitive. With this innovation strategy and growing use of Kubernetes, the company is healthy, despite challenges in the hospitality industry.

The company’s initial infrastructure was an on-premise, VM-based environment. Moving to a cloud-native, microservices-centric environment was a goal, and by 2017 they began this transition. They started working with Amazon Web Services (AWS) and by 2018, had created a global cloud distribution, handling large local workloads all over the world. The technology transformation continued as they started moving applications into Docker containers to drive management and cost efficiencies.

Moving to Kubernetes and Finding a Management Tool

Then, with the groundswell behind Kubernetes, the Hotelbeds team knew moving to feature-rich platform was the next logical step. With that came the need for an orchestration solution that could support a mix of technologies both on-premise and in the cloud. With many data centers and a proliferating cloud presence, the company also needed multi-cluster support. After exhaustive market analysis, Rancher emerged as the clear choice, with its ability to support a multi-cluster, multi-cloud and hybrid cloud/on-premise architecture.

After further testing with Rancher in non-critical data apps, Hotelbeds moved into production in 2020, running Kubernetes clusters both on-premise and in Google Cloud Platform and AWS. With Rancher, they reduced cloud migration time by 90 percent and reduced cluster deployment time by 80 percent.

Read our case study to hear how Rancher gives Hotelbeds the flexibility to manage deployments across AWS regions while scaling on-premise clusters 90 percent faster at 35 percent less cost.

SUSE’s Guide to Microsoft Ignite 2020!

Monday, 14 September, 2020

SUSE is getting ready for Microsoft Ignite September 22-24 coming to you via digital!

SUSE is proud to be a globally managed strategic ISV for Microsoft. SUSE and Microsoft have been partnering for 12 years now and both companies have 20-year strategic relationship with SAP.

We’ll be at Ignite talking technical audiences about our SAP platform which offers simplified deployment, modernized capabilities and accelerated insights to run the next generation SAP landscapes.

SUSE will be a featured partner at Microsoft Ignite this year.   Come visit us at our Virtual Booth.  And while you are tuned in, we also recommend the following sessions:

Unlock cost savings and maximize value with Azure Infrastructure  

Organizations are adjusting IT priorities to reduce costs, accelerate cloud adoption, and invest in new areas to prepare for future growth. Join Corporate Vice President, Erin Chapple, to learn how the latest Azure innovations help you achieve these goals with demos and real-world examples

Tuesday, September 22

7:30 PM – 8:00 PM PDT

Duration 30 min


Accelerate cloud migration & innovation with Linux on Azure

SUSE customers Lufthansa, Accenture and Walgreens run their mission critical apps with Linux infrastructure on Azure. Come learn about the latest updates and benefits of running Linux workloads in Azure, and how we partner with Linux distribution partners and ISVs to improve this experience. We’ll cover what’s new for Linux on Azure for you to migrate, operate and manage your infrastructure and workloads, including tools and new cost-effective licensing models.

Wednesday, September 23

11:15 PM – 11:45 PM PDT

Duration 30 min


Running mission critical workloads – like SAP – in Azure for business resilience

Organizations are migrating business-critical applications like SAP, e-commerce sites, and systems of record to Azure. Attend this session to understand Azure’s capabilities to run core applications in the cloud, enabling your business to respond quickly to changing market conditions. Learn how customers scale their core applications on Azure without compromising performance and use its compliance and security certifications to protect their most valuable data.

On Demand Session


Azure SQL: What to use when and updates from the Product Group

Come learn about the latest capabilities in the Azure SQL family (VM, SQL Managed Instance, SQL Database) in the past year, along with the latest “game changers” that Azure SQL brings to the table for organizations, including hyperscale, serverless, intelligence, and more.

On Demand Session


Be sure to register so you can get all the real time updates from Ignite. In the meantime, follow @SUSE for the latest news and updates.