Rancher 2.5 Keeps Customers Free from Kubernetes Lock-in

Wednesday, 21 October, 2020
Discover what’s new in Rancher 2.5

Rancher Labs has launched its much-anticipated Rancher version 2.5 into the cloud-native space, and we at LSD couldn’t be more excited. Before highlighting some of the new features, here is some context as to how we think Rancher is innovating.

Kubernetes has become one of the most important technologies adopted by companies in their quest to modernize. While the container orchestrator, a fundamental piece of the cloud-native journey, has many advantages, it can also be frustratingly complex and challenging to architect, build, manage and maintain. One of the considerations is the deployment architecture, which leads many companies to want to deploy a hybrid cloud solution often due to cost, redundancy and latency reasons. This is often on premises and multi cloud.

All of the cloud providers have created Kubernetes-based solutions — such as EKS on AWS, AKS on Azure and GKE on Google Cloud. Now businesses can adopt Kubernetes at a much faster rate with less effort, compared to their technical teams building Kubernetes internally. This sounds like a great solution — except for perhaps the reasons above: cost, redundancy and latency. Furthermore, we have noticed a trend of no longer being cloud native, but AWS native or Azure native. The tools and capabilities are vastly different from cloud to cloud, and they tend to create their own kind of lock-in.

The cloud has opened so many possibilities, and the ability to add a credit card and within minutes start testing your idea is fantastic. You don’t have to submit a request to IT or wait weeks for simple infrastructure. This has led to the rise of shadow IT, with many organizations bypassing the standards set out to protect the business.

We believe the new Rancher 2.5 release addresses both the needs for standards and security across a hybrid environment while enabling efficiency in just getting the job done.

Rancher has also released K3s, a highly available certified Kubernetes distribution designed for the edge. It supports production workloads in unattended, resource-constrained remote locations or inside IoT appliances.

Enter Rancher 2.5: Manage Kubernetes at Scale

Rancher enables organizations to manage Kubernetes at scale, whether on-premise or in the cloud, through a single pane of glass, providing for a consistent experience regardless of where your operations are happening. It also enables you to import existing Kubernetes clusters and centrally manage. Rancher has taken Kubernetes and beefed it up with the required components to make it a fantastic enterprise-grade container platform. These components include push-button platform upgrades, SDLC pipeline tooling, monitoring and logging, visualizing Kubernetes resources, service mesh, central authorization, RBAC and much more.

As good as that sounds, what is the value in unifying everything under a platform like Rancher? Right off the bat there are three obvious benefits:

  • Consistently deliver a high level of reliability on any infrastructure
  • Improve DevOps efficiency with standardized automation
  • Ensure enforcement of security policies on any infrastructure

Essentially, it means you don’t have to manage each Kubernetes cluster independently. You have a central point of visibility across all clusters and an easier time with security policies across the different platforms.

Get More Value out of Amazon EKS

With the release of Rancher 2.5, enhancements enhanced of the EKS platform support means that you can now derive even more value from your existing EKS clusters, including the following features:

  • Enhanced EKS cluster import, keeping your existing cluster intact. Simply import it and let Rancher start managing your clusters, enabling all the benefits of Rancher.
  • New enhanced configuration of the underlying infrastructure for Rancher 2.5, making it much simpler to manage.
  • New Rancher cluster-level UX explores all available Kubernetes resources
  • From an observability perspective, Rancher 2.5 comes with enhanced support for Prometheus (for monitoring) and Fluentd/Fluentbit (for logging)
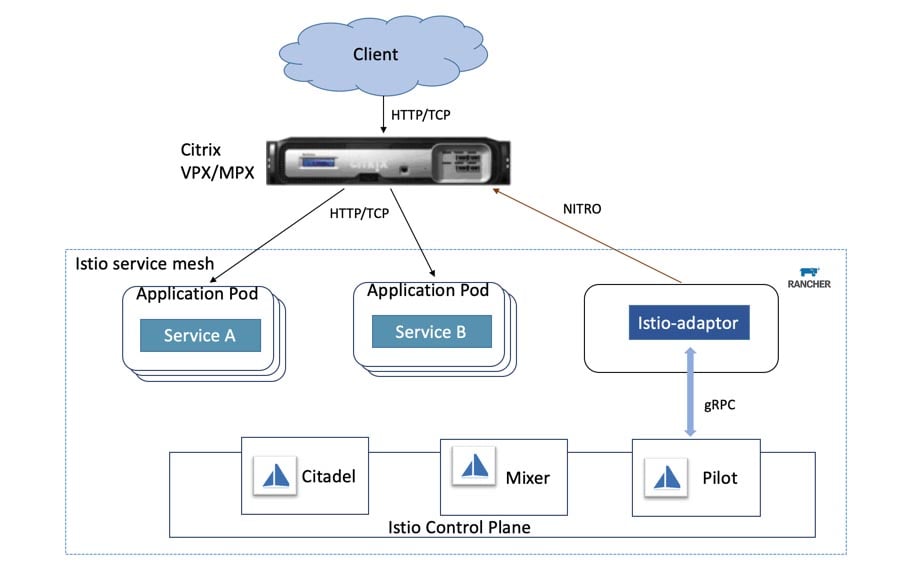
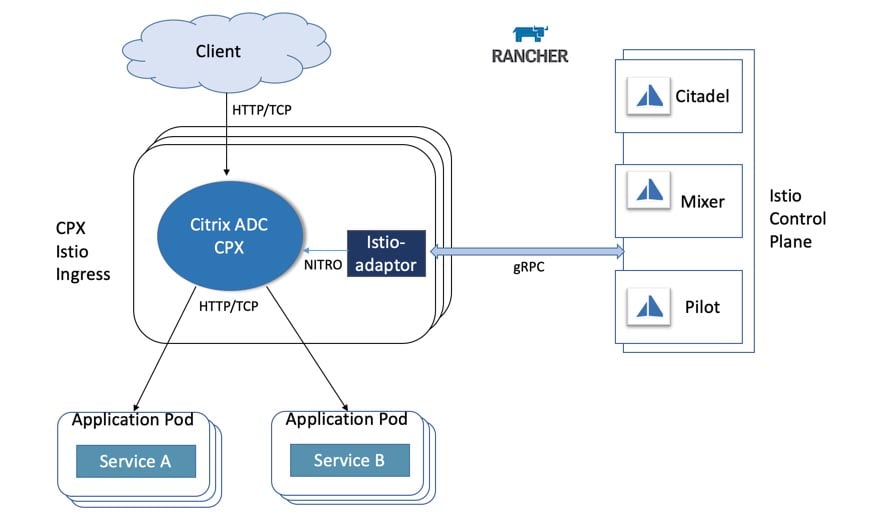
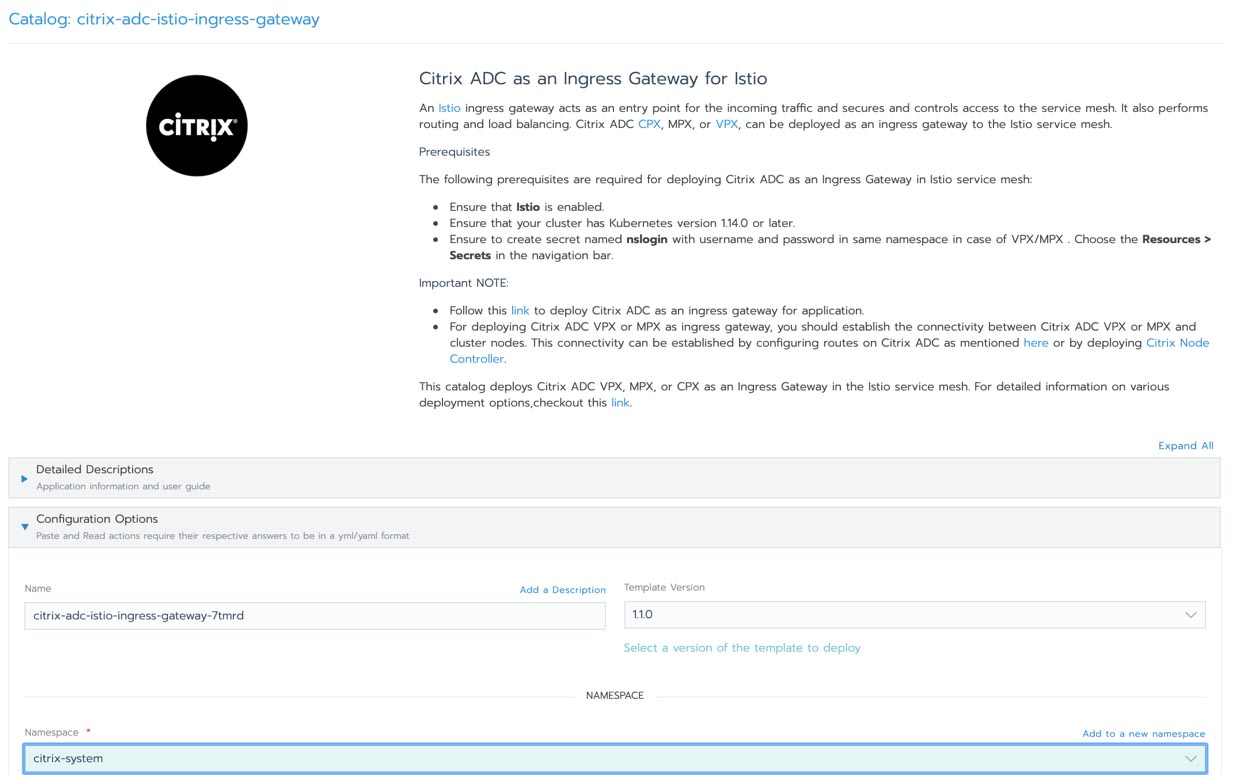
  • Istio is a service mesh that lets you connect, secure, control and observe services. It controls the flow of traffic and API calls between services and adds a layer of security through managed authentication and encryption. Rancher now fully supports Istio.
  • A constant risk highlighted with containers is security. Rancher 2.5 now includes CIS Scanning of container images. It also includes an OPA Gatekeeper (open policy agent) to describe and enforce policies. Every organization has policies; some are essential to meet governance and legal requirements, while others help ensure adherence to best practices and institutional conventions. Gatekeeper lets you automate policy enforcement to ensure consistency and allows your developers to operate independently without having to worry about compliance.

Conclusion

In our opinion, Rancher has done a spectacular job with the new additions in 2.5 by addressing critical areas that are important to customers. They have also shown that you absolutely can get the best of both EKS and fully-supported features.

LSD was founded in 2001 and wants to inspire the world by embracing open philosophy and technology, empowering people to be their authentic best selves, all while having fun. Specializing in containers and cloud native, the company aims to digitally accelerate clients through a framework called the LSDTrip. To learn more about the LSDTrip, visit us or email us.

Discover what’s new in Rancher 2.5

Gain Better Visibility into Kubernetes Cost Allocation

Wednesday, 30 September, 2020
Join The Master Class: Kubernetes Cost Allocation and Visibility, Tuesday, October 13 at 2pm ET

The Complexity of Measuring Kubernetes Costs

Adopting Kubernetes and service-based architecture can bring many benefits to organizations – teams move faster and applications scale more easily. However, visibility into cloud costs is made more complicated with this transition. This is because applications and their resource needs are often dynamic, and teams share core resources without transparent prices attached to workloads. Additionally, organizations that realize the full benefit of Kubernetes often run resources on disparate machine types and even multiple cloud providers. In this blog post, we’ll look at best practices and different approaches for implementing cost monitoring in your organization for a showback/chargeback program, and how to empower users to act on this information. We’ll also look at Kubecost, which provides an open source approach for ensuring consistent and accurate visibility across all Kubernetes workloads.

Image 01
A common Kubernetes setup with team workloads spread across Kubernetes nodes and clusters

Let’s look further into best practices for accurately allocating and monitoring Kubernetes workload costs as well as spend on related managed services.

Cost Allocation

Accurately allocating resource costs is the first critical step to creating great cost visibility and achieving high cost efficiency within a Kubernetes environment.

To correctly do this, you need to allocate costs at the workload level, by individual container. Once workload allocation is complete, costs can be correctly assigned to teams, departments or even individual developers by aggregating different collections of workloads. One framework for allocating cost at the workload level is as follows:

Image 02

Let’s break this down a bit.

The average amount of resources consumed is measured by the Kubernetes scheduler or by the amount provisioned from a cloud provider, depending on the particular resource being measured. We recommend measuring memory and CPU allocation by the maximum of request and usage. Using this methodology reflects the amount of resources reserved by the Kubernetes scheduler itself. On the other hand, resources like load balancers and persistent volumes are strictly based on the amount provisioned from a provider.

The Kubernetes API can directly measure the period of time a resource is consumed. This is determined by the amount of time spent in a Running state for resources like memory, CPU and GPU. To have numbers that are accurate enough for cloud chargeback, we recommend that teams reconcile this data with the amount of time a particular cloud resource, such as a node, was provisioned by a cloud provider. More on this in the section below.

Resource prices are determined by observing the cost of each particular resource in your environment. For example, the price of a CPU hour on a m5.xlarge spot instance in us-east-1 AWS zone will be different than the on-demand price for that same instance.

Once costs are appropriately allocated across individual workloads with this framework, they can then be easily aggregated by any Kubernetes concept, such as namespace, label, annotation or controller.

Kubernetes Cost Monitoring

With costs allocated by Kubernetes concept (pod or controller) you can begin to accurately map spend to any internal business concept, such as team, product, department or cost center. It’s common practice for organizations to segment team workloads by Kubernetes namespace, whereas others may use concepts like Kubernetes labels or annotations to identify which team a workload belongs to.

Another key element for cost monitoring across different applications, teams, etc. is determining who should pay for idle or slack capacity. This specifically refers to unused cluster resources that are still being billed to your company. Often these are either billed to a central infrastructure cost center or distributed proportionally to application teams. Assigning these costs to the team(s) responsible for provisioning decisions has shown to have positive results by aligning the incentive to have an efficiently sized cluster.

Reconciling to Cloud Bill

Kubernetes provides a wealth of real-time data. This can be used to give developers access to immediate cost metrics. While this real-time data is often precise, it may not perfectly correspond to a cloud provider’s billing data. For example, when determining the hourly rate of an AWS spot node, users need to wait on either the Spot data feed or the Cost & Usage Report to determine exact market rates. For billing and chargeback purposes, you should reconcile data to your actual bill.

Image 03

Get Better Visibility & Governance with Kubecost

We’ve looked at how you can directly observe data to calculate the cost of Kubernetes workloads. Another option is to leverage Kubecost, a cost and capacity management solution built on open source that provides visibility across Kubernetes environments. Kubecost provides cost visibility and insights across Kubernetes workloads as well as the related managed services they consume, such as S3 or RDS. This product collects real-time data from Kubernetes and also reconciles with your cloud billing data to reflect the actual prices you have paid.

Image 04
A Kubecost screenshot showing cost by Kubernetes cost by namespace

With a solution like Kubecost in place, you can empower application engineers to make informed real-time decisions and start to implement immediate and long-term practices to optimize and govern cloud spend. This includes adopting cost optimization insights without risking performance, implementing Kubernetes budgets and alerts, showback/chargeback programs or even cost-based automation.

Kubecost community version is available for free with all of these features described – and you can find the Kubecost Helm chart in the Rancher App Catalog. Rancher gives you broad visibility and control; Kubecost gives you direct insight into spend and how to optimize. Together they provide a complete cost management story for teams using Kubernetes. To learn more about how to gain visibility into your Kubernetes costs, join our Master Class on Kubernetes Cost Allocation and Visibility, Tuesday, October 13, at 2pm ET.

Join The Master Class: Kubernetes Cost Allocation and Visibility, Tuesday, October 13 at 2pm ET

Connecting the World’s Travel Trade with Kubernetes

Monday, 21 September, 2020

“We needed the flexibility to run any technologies side-by-side and a way to run clusters in multiple clouds, and a variety of environments – depending on customer needs. Rancher was the only realistic choice.” Juan Luis Sanfélix Loshuertos, IT Operations Manager – Compute & Storage, Hotelbeds

When you book a hotel online or with a travel agent, you’ve probably got a wish list that has to do with the size of the room, view, location and amenities. It’s likely you’re not thinking about the technology in the background that makes it all happen. That’s where Hotelbeds comes in. The business-to-business travel technology company operates a hotel distribution platform that travel agents, tour operators, airlines and loyalty programs use to book hotel rooms.

As the world’s leading “bedbank”, the Spanish company provides more than 180,000 hotel properties worldwide with access to distribution channels that significantly increase occupation rates. They give hoteliers access to a network of more than 60,000 hard-to-access B2B travel buyers such as tour operators, retail travel agents, airline websites and loyalty programs.

Hotelbeds attributes much of its success to a focus on technology innovation. One of the main roles of its technology teams is to experiment and validate technologies that make the business more competitive. With this innovation strategy and growing use of Kubernetes, the company is healthy, despite challenges in the hospitality industry.

The company’s initial infrastructure was an on-premise, VM-based environment. Moving to a cloud-native, microservices-centric environment was a goal, and by 2017 they began this transition. They started working with Amazon Web Services (AWS) and by 2018, had created a global cloud distribution, handling large local workloads all over the world. The technology transformation continued as they started moving applications into Docker containers to drive management and cost efficiencies.

Moving to Kubernetes and Finding a Management Tool

Then, with the groundswell behind Kubernetes, the Hotelbeds team knew moving to feature-rich platform was the next logical step. With that came the need for an orchestration solution that could support a mix of technologies both on-premise and in the cloud. With many data centers and a proliferating cloud presence, the company also needed multi-cluster support. After exhaustive market analysis, Rancher emerged as the clear choice, with its ability to support a multi-cluster, multi-cloud and hybrid cloud/on-premise architecture.

After further testing with Rancher in non-critical data apps, Hotelbeds moved into production in 2020, running Kubernetes clusters both on-premise and in Google Cloud Platform and AWS. With Rancher, they reduced cloud migration time by 90 percent and reduced cluster deployment time by 80 percent.

Read our case study to hear how Rancher gives Hotelbeds the flexibility to manage deployments across AWS regions while scaling on-premise clusters 90 percent faster at 35 percent less cost.

Is Kubernetes Delivering on its Promise?

Monday, 14 September, 2020
Don’t miss the Computing on the Edge with Kubernetes conference on October 21.

A headline in a recent Register article jumped off my screen with the claim: “No, Kubernetes doesn’t make applications portable, say analysts. Good luck avoiding lock-in, too.” Well, that certainly got my attention…for a couple of reasons. First, the emphasis on an absolute claim was quite literally shouting at me. In my experience, absolutes are rare occurrences in software engineering. Second, it was nearly impossible to imagine what evidence this conclusion was based on.

The article summarizes a report by Gartner analysts Marco Meinardi, Richard Watson and Alan Waite. I can understand if skepticism drove their conclusions – let’s acknowledge that software vendors often enjoy developing software that creates lock-in. So, if this is a reaction to past experience, I get that.

But when I look carefully at their arguments, I find the stance less compelling. Let’s look at some of their arguments in more detail:

  1. “Using Kubernetes to minimize provider lock-in is an attractive idea, but such abstraction layer simply becomes an alternative point of lock-in.”

I can certainly agree with this point. The net product of Kubernetes is that it does create a dependence on the abstraction layer itself. This is inherent to the nature of abstractions, or interfaces in general. The conclusions the authors draw in this next claim is what I think is problematic:

  1. “Although abstraction layers may be attractive for portability, they do not surface completely identical functionality from the underlying services — they often mask or distort them.”

This statement misses the point. It’s probably true that abstraction layers do not achieve “completely identical functionality,” but this is not in question.

An abstraction layer’s virtue is not that it is 100 percent accurate or perfect, but that it sufficiently handles the majority of cases identically. I would put this claim in context that perfection is not a requirement for Kubernetes to be beneficial.

Even if Kubernetes provided portability for 80 percent of use cases, that is still far better than the status quo (building with complete dependence on a traditional cloud provider). There you have very little portability. And especially for net-new projects, where you absorb the cost of building for either IaaS or Kubernetes, why not take one that offers you 80 percent more upside? This claim fails to understand Kubernetes’ value position.

  1. “The more specific to a provider a compute instance is, the less likely it is to be portable in any way. For example, using EKS on [AWS] Fargate is not CNCF-certified and arguably not even standard Kubernetes. The same is true for virtual nodes on Azure as implemented by ACIs.”

I suspect this claim is used to support the previous one that the abstraction layer is not consistent and therefore fails at providing its intended value. The problem here is that the examples are results of specific approaches to Kubernetes and not inherent to Kubernetes itself. That is, Kubernetes’ design or approach does not produce situations where there are incompatible implementations. Instead, these are the result of specific vendors making implementation choices to break compatibility. And in many cases, innovation sometimes requires trying something new, but it doesn’t mean it is the only option. In fact, there 32 other conforming Kubernetes distributions to choose from that won’t have compatibility issues. Therefore, the authors selecting a handful of the most extreme examples is not an accurate reflection of the CNCF ecosystem.

Like I said earlier, I can certainly sympathize with there being many examples of “new platforms” that claim to provide freedom but, in fact, do not. Yet we can’t let experiences taint our ability to try new things in technology. Kubernetes isn’t perfect. It’s not the solution to all engineering problems, nor is it a tool everyone should use. But in my career as a Site Reliability Engineer and a consultant, I’ve seen first-hand real improvements over previous technologies that offer measurable value to engineering teams and the businesses that depend on them.

Avoid Kubernetes Lock-In With Rancher

At Rancher Labs, we base our business model on the idea of avoiding lock-in – and we really preach this doctrine. You might find this statement curious because I just pointed out that vendors often do the opposite. So, the obvious question is: why is Rancher any different? Well, I can answer that, but I suspect you’ll get a better answer by investigating that yourself. Talk to our customers, look at our software – which is all open source and non-proprietary. I suspect you’ll find that Rancher is in business because we continue to provide a valuable experience, not because a customer has no other option. And organizations like the CNCF keep us accountable by measuring both our Kubernetes distributions (K3s and RKE) against a rigorous conformance test. But most importantly, our customers keep us accountable, because they elect every year to keep us in business or not. It’s not the easiest business to be in, but it certainly is the most rewarding.

Don’t miss the Computing on the Edge with Kubernetes conference on October 21.
Tags: ,,,, Category: Uncategorized Comments closed

Integrate AWS Services into Rancher Workloads with TriggerMesh

Wednesday, 9 September, 2020
Don’t miss the Computing on the Edge with Kubernetes conference on October 21.

Many businesses use cloud services on AWS and also run workloads on Kubernetes and Knative. Today, it’s difficult to integrate events from AWS to workloads on a Rancher cluster, preventing you from taking full advantage of your data and applications. To trigger a workload on Rancher when events happen in your AWS service, you need an event source that can consume AWS events and send them to your Rancher workload.

TriggerMesh Sources for Amazon Web Services (SAWS) are event sources for AWS services. Now available in the Rancher catalog, SAWS allows you to quickly and easily consume events from your AWS services and send them to your workloads running in your Rancher clusters.

SAWS currently provides event sources for the following Amazon Web Services:

TriggerMesh SAWS is open source software that you can use in any Kubernetes cluster with Knative installed. In this blog post, we’ll walk through installing SAWS in your Rancher cluster and demonstrate how to consume Amazon SQS events in your Knative workload.

Getting Started

To get you started, we’ll walk you through installing SAWS in your Rancher cluster, followed by a quick demonstration of consuming Amazon SQS events in your Knative workload.

SAWS Installation

  1. TriggerMesh SAWS requires the Knative serving component. Follow the Knative documentation to install the Knative serving component in your Kubernetes cluster. Optionally, you may also install the Knative eventing component for the complete Knative experience. We used:
    kubectl --namespace kong get service kong-proxy

    We created a cluster from the GKE provider. A LoadBalancer service will be assigned an external IP, which is necessary to access the service over the internet.

  2. With Knative serving installed, search for aws-event-sources from the Rancher applications catalog and install the latest available version from the helm3-library. You can install the chart at the Default namespace.

    Image 01

Remember to update the Knative Domain and Knative URL Scheme parameters during the chart installation. For example, in our demo cluster we used Magic DNS (xip.io) for configuring the DNS in the Knative serving installation step, so we specified 34.121.24.183.xip.io and http as the values of Knative Domain and Knative URL Scheme, respectively.

That’s it! Your cluster is now fully equipped with all the components to consume events from your AWS services.

Demonstration

To demonstrate the TriggerMesh SAWS package functionality, we will set up an Amazon SQS queue and visualize the queue events in a service running on our cluster. You’ll need to have access to the SQS service on AWS to create the queue. A specific role is not required. However, make sure you have all the permissions on the queue: see details here.

Step 1: Create SQS Queue

Image 02

Log in to the Amazon management console and create a queue.

Step 2: Create AWS Credentials Secret

Create a secret named awscreds containing your AWS credentials:

$ kubectl -n default create secret generic awscreds 

--from-literal=aws_access_key_id=AKIAIOSFODNN7EXAMPLE 

--from-literal=aws_secret_access_key=wJalrXUtnFEMI/K7MDENG/bPxRfiCYEXAMPLEKEY

Update the values of aws_access_key_id and aws_secret_access_key in the above command.

Step 3: Create the AWSSQSSource Resource

Create the AWSSQSSource resource that will bring the events that occur on the SQS queue to the cluster using the following snippet. Remember to update the arn field in the snippet with that of your queue.

$ kubectl -n default create -f - << EOF

apiVersion: sources.triggermesh.io/v1alpha1

kind: AWSSQSSource

metadata:

name: my-queue

spec:

arn: arn:aws:sqs:us-east-1:043455440429:SAWSQueue

credentials:

  accessKeyID:

    valueFromSecret:

     name: awscreds

     key: aws_access_key_id

  secretAccessKey:

    valueFromSecret:

     name: awscreds

     key: aws_secret_access_key

sink:

 ref:

    apiVersion: v1

   kind: Service

   name: sockeye

EOF

Check the status of the resource using:

$ kubectl -n default get awssqssources.sources.triggermesh.io

NAME READY REASON SINK AGE

my-queue True http://sockeye.default.svc.cluster.local/ 3m19s

Step 4: Create Sockeye Service

Sockeye is a WebSocket-based CloudEvents viewer. Our my-queue resource created above is set up to send the cloud events to a service named sockeye as configured in the sink section. Create the sockeye service using the following snippet:

$ kubectl -n default create -f - << EOF

apiVersion: serving.knative.dev/v1

kind: Service

metadata:

name: sockeye

spec:

template:

 spec:

   containers:

    - image: docker.io/n3wscott/sockeye:v0.5.0@sha256:64c22fe8688a6bb2b44854a07b0a2e1ad021cd7ec52a377a6b135afed5e9f5d2

EOF

Next, get the URL of the sockeye service and load it in the web browser.

$ kubectl -n default get ksvc

NAME URL LATESTCREATED LATESTREADY READY REASON

sockeye http://sockeye.default.34.121.24.183.xip.io sockeye-fs6d6 sockeye-fs6d6 True

Step 5: Send Messages to the Queue

We now have all the components set up. All we need to do is to send messages to the SQS queue.

Image 03

The cloud events should appear in the sockeye events viewer.

Image 04

Conclusion

As you can see, using TriggerMesh Sources for AWS makes it easy to consume cloud events that occur in AWS services. Our example uses Sockeye for demonstration purposes: you can replace Sockeye with any of your Kubernetes workloads that would benefit from consuming and processing events from these popular AWS services.

The TriggerMesh SAWS package supports a number of AWS services. Refer to the README for each component to learn more. You can find sample configurations here.

Don’t miss the Computing on the Edge with Kubernetes conference on October 21.
Tags: ,,, Category: Products, Rancher Kubernetes Comments closed

Driving Kubernetes Adoption in Finance with Rancher

Tuesday, 8 September, 2020
See how Inventx reduced deployment time by 75% with Rancher

“Our portfolio is geared toward creating long-term digital business models in the financial industry. Inventx is the enabler for continuous business transformation. Rancher brings the flexibility and openness that helps us achieve true transformation in the most agile and efficient way.” Domenic Mayer, Senior Cloud Engineer and Solution Architect, Inventx

Supporting Microservices and Cloud Native

In Switzerland, Inventx is the IT partner of choice for financial and insurance service providers. Its full-stack DevOps platform, ix.AgileFactory, allows financial organizations to move to a modern, cloud-native and microservices-centric infrastructure. The platform decouples core applications from the central infrastructure, allowing organizations to better manage and innovate applications in safety.

Like most companies in the financial space, Inventx has a secure, on-premise architecture that, until four years ago, comprised a mix of VM-based IBM architecture and Linux (Red Hat) servers. Due to obvious customer sensitivities, security and compliance have always been major priorities.

Adopting Containers, Kubernetes and Rancher

Containers became a focus at the company in 2016, when Inventx developers started building and shipping images in Docker. It was clear that adopting a container strategy would be a much more lightweight, portable way to develop, shift and deploy applications. When Kubernetes adoption hastened in 2017, the team looked at management methodologies. They knew a “monocluster” model wouldn’t work; enabling digital transformation meant providing dedicated clusters for each customer, comprising development, testing and production environments. Crucially, the team wanted a unified cluster management platform that would provide simplified, multi-cluster management via a single pane of glass.

Gaining Efficiencies with Rancher

Inventx added Rancher to its existing infrastructure to provide multi-cluster, hybrid support. In Rancher, Inventx was able to manage any number of Kubernetes clusters in one place, via one pane of glass. For the first time, the company could consolidate management processes, monitor performance, update, patch and manage the entire Kubernetes estate in a unified way. Rancher also allowed the team to work with any mix of technologies, in the same platform.

Today, Rancher now underpins ix.AgileFactory. With the financial sector under pressure to be more agile, efficient and secure, Rancher answers those requirements by allowing organizations to manage via a single interface.

With Rancher, Inventx has reduced deployed time by 75 percent and increased deployment frequency by 100 percent. Read our case study to find out how they achieved these and other efficiency gains.

See how Inventx reduced deployment time by 75% with Rancher

Deploying Citrix ADC with Service Mesh on Rancher

Wednesday, 26 August, 2020

Introduction

As a network of microservices changes and grows, the interactions between them can be difficult to manage and understand. That’s why it’s handy to have a service mesh as a separate infrastructure layer. A service mesh is an approach to solving microservices at scale. It handles routing and terminating traffic, monitoring and tracing, service delivery and routing, load balancing, circuit breaking and mutual authentication. A service mesh takes these components and makes them part of the underlying infrastructure layer, eliminating the need for developers to write specific code to enable these capabilities.

Istio is an popular open source service mesh that is built into the Rancher Kubernetes management platform. This integration allows developers focus on their business logic and leave the rest to Kubernetes and Istio.

Citrix ADC is a comprehensive application delivery and load balancing solution for monolithic and microservices-based applications. Its advanced traffic management capabilities enhance application performance and provide comprehensive security. Citrix ADC integrates with Istio as an ingress gateway to the service mesh environment and as a sidecar proxy to control inter-microservice communication. This integration allows you to tightly secure and optimize traffic into and within your microservice-based application environment. Citrix ADC’s Ingress deployment is configured as a load balancer for your Kubernetes services. As a sidecar proxy, Citrix ADC handles service-to-service communication and makes this communication reliable, secure, observable and manageable.

In this blog post, we’ll discuss the integration of Citrix ADC as an Istio ingress gateway and sidecar proxy in Istio service mesh deployed on Rancher. We’ll introduce new catalog templates for deploying for Citrix ADC as an ingress gateway and as a sidecar proxy injector.

The Rancher Apps Catalog provides a UI platform for DevOps engineers to deploy and run applications with out-of-the-box capabilities like monitoring, auditing and logging. You can find the Citrix Istio ingress gateway and sidecar injector in the Rancher catalog.

Image 01
Figure 1 Rancher Catalog for Citrix ADC in Istio Service Mesh

Citrix ADC as an Ingress Gateway for Istio

An Istio ingress gateway acts as an entry point for incoming traffic and secures and controls access to the service mesh. It also performs routing and load balancing. Citrix ADC CPX, MPX or VPX can be deployed as an ingress gateway to control the ingress traffic to Istio service mesh.

Citrix ADC MPX or VPX as Ingress Gateway

Image 02
Figure 2 Citrix ADC VPX/MPX as Ingress Gateway in Rancher Catalog

When Citrix ADC MPX/VPX is deployed as an Ingress Gateway device, the Istio-adaptor container primarily runs inside a pod managed by the Ingress Gateway deployment.

Citrix ADC CPX as an Istio Ingress Gateway

When Citrix ADC CPX is deployed as Ingress Gateway, both CPX and Istio-adaptor run as containers inside the Ingress Gateway Pod.

Image 03
Figure 3 Citrix ADC CPX as ingress gateway in Rancher Catalog

Citrix Istio Adaptor

Citrix Istio Adaptor is open source software written in Go. Its main job is to automatically configure the Citrix ADC deployed in the Istio service mesh. Components such as Istio Pilot, Citadel and Mixer make up the Istio control plane. The pilot is the control plane component that provides service discovery to proxies in the mesh. It’s essentially a gRPC xDS server and is responsible for configuring proxies at runtime.

Istio-adaptor is a gRPC client to the xDS server and receives xDS resources such as clusters, listeners, routes and endpoints from the xDS server over a secure gRPC channel. After receiving these resources, the Istio-adaptor converts them to the equivalent Citrix ADC configuration blocks and configures the associated Citrix ADC using RESTful NITRO calls. This blog talks about Citrix Istio Adaptor in detail.

In the next section, we’ll set up Citrix ADC as gateway and sidecar using the Rancher catalog. Ingress Gateway describes a load balancer operating at the edge of the mesh that receives incoming connections. Sidecar proxy is enforced for monitoring, security and resource distribution.

Rancher Catalog for Citrix ADC as an Istio Ingress Gateway

Prerequisites

In order to follow these steps, you will need to following:

  • A Rancher deployment (check out the quick start guide to get Rancher up and running)
  • A Kubernetes cluster, managed by Rancher (follow this guide to either import or provision a cluster)
  • Enable Istio.
  • Ensure that your cluster has Kubernetes version 1.14.0 or later and the admissionregistration.k8s.io/v1beta1 API is enabled.
  • Create a Kubernetes secret for the Citrix ADC user name and password. Choose Resources → Secrets in the navigation bar.

Steps:

  1. Log in to Rancher.
  2. Create a namespace named citrix-system.
  3. Go to the cluster, then project and Navigate to App → Launch.
  4. Search for citrix in search box.
  5. Click on citrix-adc-istio-ingress-gateway catalog.

    Image 04
    Figure 4 Citrix ADC as Ingress Gateway for Istio in Rancher Catalog

  6. Click on launch to deploy the Citrix ADC as ingress gateway.

a. For Citrix ADC CPX: Set the following environment variables with specified values:

i. Citrix ADC CPX – true
ii. ingressGateway EULA – true
iii. istioAdaptor.tag – 1.2.0

b. For Citrix ADC MPX/VPX: Set the following environment variables:

i. istioAdaptor version: 1.2.0
ii. netscalerUrl: Specify Citrix ADC IP in URL format (e.g. https://192.168.1.10)
iii. vServer IP: Specify yet to be used IP Address for Citrix ADC Virtual Server

  1. Once you update values of required parameters, click on launch. Navigate to Apps and verify that citrix-ingressgateway is running.

    Image 05
    Figure 5 Service citrix-ingressgateway Running in Rancher Catalog

Points to remember:

  • If you want to expose multiple applications:

Set exposeMutipleApps variable to true.

  • secretVolumes.name:
  • secretVolumes.secretName:
  • secretVolumes.mountPath:
  • If You want to expose non-HTTP services (such as TCP-based apps):

Set the exposeNonHttpService variable to true.

  • tcpPort.name:
  • tcpPort.nodePort: . // applicable in case of Citrix ADC CPX
  • tcpPort.Port:
  • tcpPort.targetPort:

Citrix ADC as a Sidecar for Istio

Citrix ADC CPX can act as a sidecar proxy to an application container in Istio. You can inject the Citrix ADC CPX manually or automatically using the Istio sidecar injector. Automatic sidecar injection requires resources including a Kubernetes mutating webhook admission controller and a service. Using the Rancher catalog, you can create resources required for automatically deploying Citrix ADC CPX as a sidecar proxy.

Image 06
Figure 6 Citrix ADC CPX as sidecar in Rancher Catalog

Deploying Citrix ADC as a Sidecar for Istio using Rancher Catalog

Prerequisites

The following prerequisites are required for deploying Citrix ADC as a sidecar in an application pod

  • Ensure that Istio is enabled.
  • Ensure that your cluster has Kubernetes version 1.14.0 or later and the admissionregistration.k8s.io/v1beta1 API is enabled.
  • Create resources required for automatic sidecar injection by performing the following steps:
  1. Download the webhook-create-signed-cert.sh script.

    curl -L https://raw.githubusercontent.com/citrix/citrix-istio-adaptor/master/deployment/webhook-create-signed-cert.sh > webhook-create-signed-cert.sh

  2. Change permissions of the script to executable mode.

    chmod +x webhook-create-signed-cert.sh

  3. Create a signed certificate, key pair and store it in a Kubernetes secret.
    ./webhook-create-signed-cert.sh 
    
    --service cpx-sidecar-injector 
    
    --secret cpx-sidecar-injector-certs 
    
    --namespace citrix-system

Important Note:

Do not enable Istio Auto Injection on application namespace.

To automatically deploy Citrix ADC CPX as a sidecar in application pod, the application namespace must be labeled with cpx-injection=enabled.

Kubectl label namespace <application_namespace> cpx-injection=enabled

Steps:

  1. Log in to Rancher.
  2. Create namespace named citrix-system.
  3. Go to the cluster then project and Navigate to Apps → Launch.
  4. Search for citrix into search box.
  5. Click on citrix-cpx-istio-sidecar-injector catalog.

    Image 07
    Figure 7 Citrix ADC CPX as sidecar in Rancher Catalog

  6. Set the environment variables:

a. istioAdaptor version: 1.2.0
b. cpxProxy.EULA : YES

  1. Update the values of the required parameters, click Launch.
  2. Navigate to Apps and verify that cpx-sidecar-injector is running.

    Image 08
    Figure 8 Service cpx-sidecar-injector Running in Rancher Catalog

Accessing a Sample Application using Citrix ADC

You can find an example of deploying the sample bookinfo application here.

  • If Citrix ADC VPX/MPX is deployed as ingress gateway, the service will be accessible via vServer IP. (This detail is mentioned in step 6b of Citrix ADC VPX as ingress gateway deployment).
  • If Citrix ADC CPX is deployed as ingress Gateway, then service will be accessible via Ingress IP and Port. Follow this link for more information.

Important Note: For deploying Citrix ADC VPX or MPX as an ingress gateway, you should establish the connectivity between Citrix ADC VPX or MPX and cluster nodes. This connectivity can be established by configuring routes on Citrix ADC as mentioned here or by deploying Citrix Node Controller.

Note: All images of the catalog were taken from Rancher version v.2.4.4, which supports Istio version 1.4.10 and Istio-adaptor with version 1.2.0. Learn more about the architecture here.

Conclusion

In this article, we have shown you how to configure ingress rules using Citrix ADC Istio ingress gateway and also sidecar proxy using Citrix CPX Istio Sidecar. The gateway allows external traffic to enter the service mesh and manage traffic for edge services. Citrix ADC as sidecar is used in service-to-service communication alongside each service through which all traffic is transparently routed.

Rancher’s catalog of Helm charts makes it easy to deploy and configure applications.

Learn how to run a multi-cluster service mesh in Rancher: watch our master class video.

Creating Memorable Gaming Experiences with Kubernetes

Thursday, 13 August, 2020

“Every technology decision is designed to make the experiences of players more satisfying. It’s not just the quality of the games, it’s how we  create  the  responsive, rewarding and engaging services that surround them. Rancher is essential to this.” Donald Havas, Senior Cloud Services Manager, Ubisoft

If you’re a gamer, you probably know how immersed you can get in your favorite game. Or if you’re the parent or partner of a gamer, you probably know what it’s like to try to get the attention of someone who is in “gaming mode.” Creating worlds and enriching players’ lives is in Ubisoft’s DNA. The French video game pioneer is the name behind some of the biggest gaming titles in history, including Assassin’s Creed, Far Cry, the Tom Clancy series and Just Dance.

Moving to Cloud-Native with Kubernetes

Boosting innovation and driving technical agility are the company’s primary goals – and Kubernetes is becoming essential to this strategy. With its sights set on global growth, Ubisoft has put Rancher Labs at the heart of its Ubisoft Kubernetes Service (UKS). With Kubernetes and Rancher, the technology team at Ubisoft is accelerating the journey toward a cloud-native, microservices-centric future. The aim? To gain a competitive edge through innovation and, critically, to drive serious management efficiencies.

Ubisoft’s infrastructure team was an early adopter of containers and standardized on Kubernetes in 2017 after seeing the momentum around it. Given the freedom to innovate with Kubernetes, Ubisoft’s teams of developers were galvanized. New container deployments began to spring up all over the business. While not required to work in Kubernetes, developers started to test it, creating new services and applications quickly.

When the inevitable happened – cluster sprawl – due to pockets of innovation and development across the company, they realized they needed a formal orchestration strategy. They wanted a solution that sat close to the upstream Kubernetes community. In March 2018, after a successful PoC, they started using Rancher.

Centralizing Cluster Management with Rancher

The team’s vision of a central Kubernetes provisioning platform to automate many basic processes came to life in the Ubisoft Kubernetes Service. This self-service Kubernetes platform, based on Rancher, gives thousands of developers the ability to spin up new Kubernetes clusters in an instant in a controllable, centrally managed way.

Ubisoft’s Kubernetes clusters host its internal video platform, shopping toolbox and a host of game administration tools that help teams plan discount and loyalty programs. Ubisoft’s gaming support tool – a user-facing service that uses machine learning to help support specialist to answer players – is another critical service.

Read our case study to hear how Ubisoft has reduced cluster deployment time by 80 percent – allowing them to spend more time innovating and creating satisfying player experiences.

Tags: ,,, Category: Products, Rancher Kubernetes Comments closed

Monitor and Optimize Your Rancher Environment with Datadog

Tuesday, 4 August, 2020
Read our free white paper: How to Build a Kubernetes Strategy

Many organizations use Kubernetes to quickly ship new features and improve the reliability of their services. Rancher enables teams to reduce the operational overhead of managing their cloud-native workloads — but getting continuous visibility into these environments can be challenging.

In this post, we’ll explore how you can quickly start monitoring orchestrated workloads with Rancher’s built-in support for Prometheus and Grafana. Then we’ll show you how integrating Datadog with Rancher can help you get even deeper visibility into these ephemeral environments with rich visualizations, algorithmic alerting, and other features.

The Challenges of Kubernetes Monitoring

Kubernetes clusters are inherently complex and dynamic. Containers spin up and down at a blistering rate: in a survey of more than 1.5 billion containers across thousands of organizations, Datadog found that orchestrated containers churned twice as fast (one day) as unorchestrated containers (two days).

In such fast-paced environments, monitoring your applications and infrastructure is more important than ever. Rancher includes baked-in support for open source monitoring tools like Prometheus and Grafana, allowing you to track basic health and resource metrics from your Kubernetes clusters.

Prometheus gathers metrics from Kubernetes clusters at preset intervals. While Prometheus has no visualization options, you can use Grafana’s built-in dashboards to display an overview of health and resource metrics, such as the CPU usage of your pods.

However, some open source solutions aren’t designed to keep tabs on large, dynamic Kubernetes clusters. Further, Prometheus requires users to learn PromQL, a specialized query language, to analyze and aggregate their data.

While Prometheus and Grafana can provide some level of insight into your clusters, they don’t allow you to see the full picture. For example, you’ll need to connect to one of Rancher’s supported logging solutions to access logs from your environment. And to troubleshoot code-level issues, you’ll also need to deploy an application performance monitoring solution.

Ultimately, to fully visualize your orchestrated clusters, you need to monitor all of these sources of data — metrics, traces and logs — in one platform. By delivering detailed, actionable data to teams across your organization, a comprehensive monitoring solution can help reduce mean time to detection and resolution (MTTD and MTTR).

The Datadog Agent: Auto-Discover and Autoscale Services

To get ongoing visibility into every layer of your Rancher stack, you need a monitoring solution specifically designed to track cloud-native environments in real time. The Datadog Agent is lightweight, open source software that gathers metrics, traces and logs from your containers and hosts, and forwards them to your account for visualization, analysis and alerting.

Because Kubernetes deployments are in a constant state of flux, it’s impossible to manually track which workloads are running on which nodes, or where your containers are running. To that end, the Datadog Agent uses Autodiscovery to detect when containers spin up or down, and automatically starts collecting data from your containers and the services they’re running, like etcd and Consul.

Kubernetes’ built-in autoscaling functionality can help improve the reliability of your services by automatically scaling workloads based on demand (such as a spike in CPU usage). Autoscaling also helps manage costs by rightsizing your infrastructure.

Datadog extends this feature by enabling you to autoscale Kubernetes workloads based on any metric you’re already monitoring in Datadog — including custom metrics. This can be extremely useful for scaling your cluster in response to fluctuations in demand, particularly during business-critical periods like Black Friday. Let’s say that your organization is a retailer with a bustling online presence. When sales are taking off, your Kubernetes workloads can autoscale based on a custom metric that serves as an indicator of activity, such as the number of checkouts, to ensure a seamless shopping experience. For more details about autoscaling Kubernetes workloads with Datadog, check out our blog post.

Kubernetes-Specific Monitoring Features

Regardless of whether your environment is multi-cloud, multi-cluster or both, Datadog’s highly specialized features can help you monitor your containerized workloads in real time. Datadog automatically enriches your monitoring data with tags imported from Kubernetes, Docker, cloud services and other technologies. Tags provide continuous visibility into any layer of your environment, even as individual containers start, stop or move across hosts. For example, you can search for all containers that share a common tag (e.g., the name of the service they’re running) and then use another tag (e.g., availability zone) to break down their resource usage across different regions.

Datadog collects more than 120 Kubernetes metrics that help you track everything from Control Plane health to pod-level CPU limits. All of this monitoring data can be accessed directly in the app — no query language needed.

Datadog provides several features to help you explore and visualize data from your container infrastructure. The Container Map provides a bird’s-eye view of your Kubernetes environment, and allows you to filter and group containers by any combination of tags, like docker_image, host and kube_deployment.

You can also color-code containers based on the real-time value of any resource metric, such as System CPU or RSS Memory. This allows you to quickly spot resource contention issues at a glance — for instance, if a node is consuming more CPU than others.

Image 01

The Live Container view displays process-level system metrics — graphed at two-second granularity — from every container in your infrastructure. Because metrics like CPU utilization can be extremely volatile, this high level of granularity ensures that important spikes don’t get lost in the noise.

Image 02

Both the Container Map and the Live Container view allow you to filter and sort containers using any combination of tags, such as image name or cloud provider. For more detail, you can also click to inspect the processes running on any individual container — and view all the metrics, logs and traces collected from that container, with a few clicks. This can help you debug issues and determine if you need to adjust your provisioning of resources.

With Datadog Network Performance Monitoring (NPM), you can track the real-time flow of network traffic across your Kubernetes deployments and quickly debug issues. By nature, Docker containers are constrained only by the amount of CPU and memory available. As a result, a single container can saturate the network and bring the entire system down.

Datadog can help you easily isolate the containers that are consuming the most network throughput and identify possible root causes by navigating to correlated logs or request traces from that service.

Datadog + Rancher Go Together

Datadog works in tandem with Rancher, so you can use Rancher to manage diverse, orchestrated environments and deploy Datadog to monitor, troubleshoot and automatically scale them in real time.

Additionally, Watchdog, Datadog’s algorithmic monitoring engine, uncovers and alerts team members to performance anomalies (such as latency spikes or high error rates). This allows teams to get ahead of potential issues (such as an abnormally high rate of container restarts) before they escalate.

We’ve shown you how Datadog can help you get comprehensive visibility into your Rancher environment. With Datadog, engineers can use APM to identify bottlenecks in individual requests and pinpoint code-level issues, collect and analyze logs from every container across your infrastructure and more. By unifying metrics, logs and traces in one platform, Datadog removes the need to switch contexts or tools. Thus, your teams can speed up their troubleshooting workflows and leverage the full potential of Rancher as it manages vast, dynamic container fleets.

With Rancher’s Datadog Helm chart, your teams can start monitoring their Kubernetes environments in minutes — with minimal onboarding. If you’re not currently a Datadog customer, sign up today for a free 14-day trial.

Read our free white paper: How to Build a Kubernetes Strategy