Custom Alerts Using Prometheus in Rancher
This article is a follow up to Custom Alerts Using Prometheus Queries. In this post, we will also demo installing Prometheus and configuring Alertmanager to send emails when alerts are fired, but in a much simpler way – using Rancher all the way through.
We’ll see how easy it is to accomplish this without the dependencies used in previous article. We won’t need:
- a dedicated box configured to run kubectl pointing to Kubernetes cluster
- knowledge of
kubectlas we can do everything using Rancher’s UI - helm binary installed/configured
Prerequisites for the Demo
- A Google Cloud Platform account (the free tier is sufficient). Any other cloud should work the same.
- Rancher v2.4.2 (latest version at time of publication).
- A Kubernetes cluster running on Google Kubernetes Engine version 1.15.11-gke.3. (Running EKS or AKS should be the same).
Starting a Rancher Instance
To begin, start your Rancher instance. Follow Rancher’s intuitive getting started guide.
Using Rancher to Deploy a GKE cluster
Use Rancher to set up and configure a Kubernetes cluster. You can find documentation here.
Deploying Prometheus Software
We will take advantage of Rancher’s catalog to install Prometheus. The catalog is a collection of Helm charts that make it easy to repeatedly deploy applications.
As soon as our cluster is up and running, let’s select the Default project created for it in the Apps tab and click the Launch button.

Let’s search for the chart we’re interested in. We have a bunch of fields – for this demo we will just leave the default values. You can find lots of useful information about these in the Detailed Descriptions section. Feel free to take a look to understand what they are used for. At the bottom of the page, click Launch. Prometheus Server and Alertmanager will be installed and configured.


When installation is finished it should look like this:

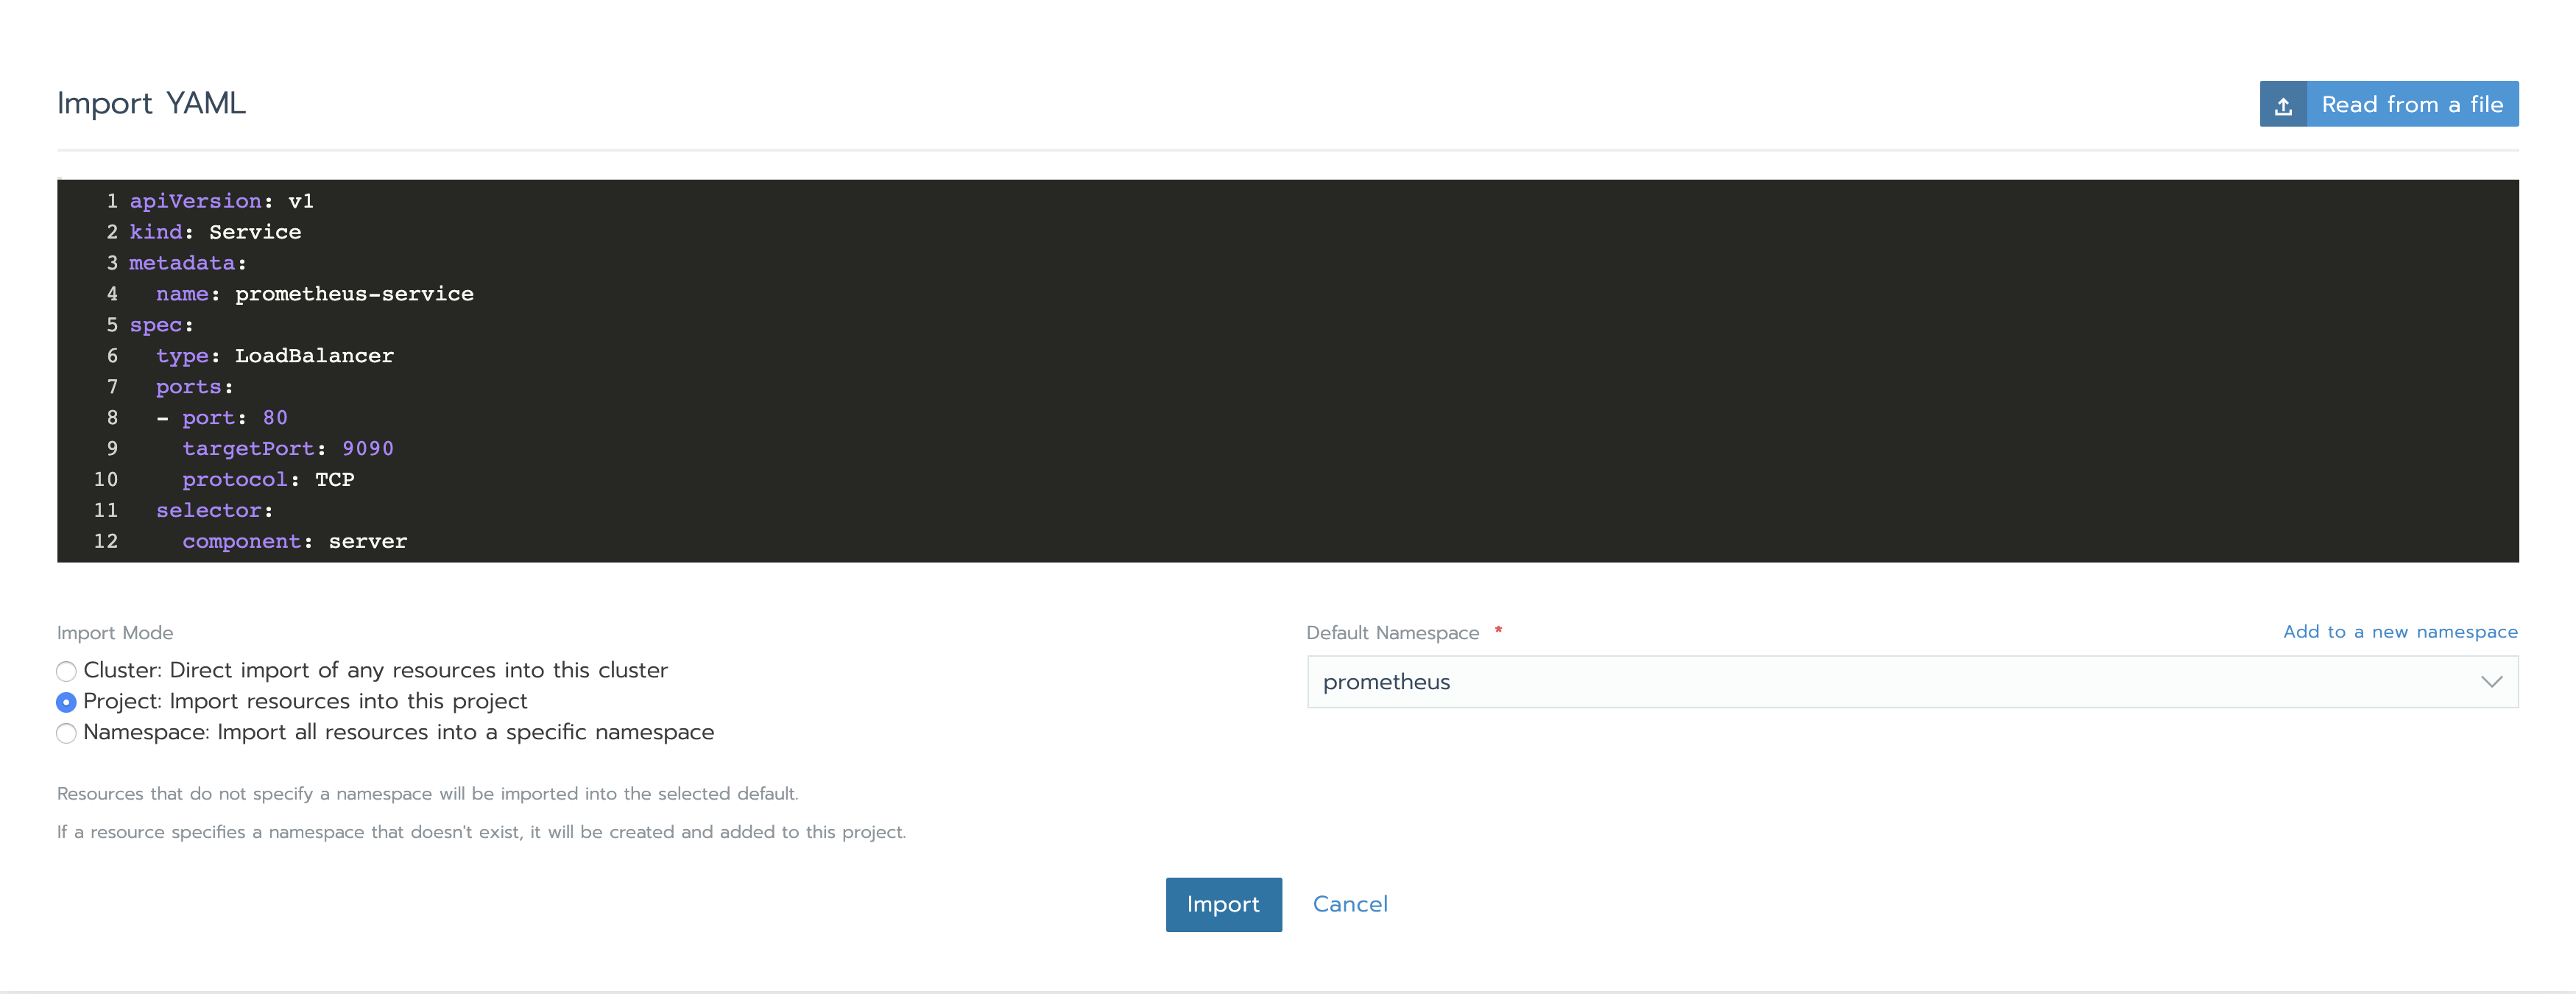
In order to access Prometheus Server and Alertmananger, we need to create Services. Under Resources -> Workload tab, in the Load Balancing section, we can see that there is no configuration of this kind yet. Click on Import YAML, select prometheus namespace, paste the two YAMLs one at a time and click Import. You will understand later how we knew to use those specific ports and components tags.
apiVersion: v1
kind: Service
metadata:
  name: prometheus-service
spec:
  type: LoadBalancer
  ports:
    - port: 80
      targetPort: 9090
      protocol: TCP
  selector:
    component: server
apiVersion: v1
kind: Service
metadata:
name: alertmanager-service
spec:
type: LoadBalancer
ports:
- port: 80
targetPort: 9093
protocol: TCP
selector:
component: alertmanager
When finished, services will show as Active.

You can find the IPs in the vertical ellipsis (3 vertical dots) menu button and clicking the View/Edit YAML. At the bottom of the yaml file, you’ll see a section similar to this:
status:
  loadBalancer:
    ingress:
      - ip: 34.76.22.14
Accessing the IPs will show us the GUI for both Prometheus Server and Alertmanager. You’ll notice that there is not much to see at this point as there are no rules defined and there is no alerting configuration.
Rules
Rules enable us to trigger alerts. These rules are based on Prometheus expression language expressions. Whenever a condition is met, the alert is fired and sent to Alertmanager.
Let’s see how we can add rules.
In Resources -> Workload tab we can see what Deployments have been created while running the chart. We are interested in prometheus-server and prometheus-alertmanager.
Let’s start with the first one and understand its configuration, how we can edit it and what port the service is running on. Let’s do this by clicking the vertical ellipsis (3 vertical dots) menu button and clicking the View/Edit YAML item.
The first thing we see is the two containers associated to this Deployment, prometheus-server-configmap-reload and prometheus-server. The section dedicated to prometheus-server container has some relevant information:
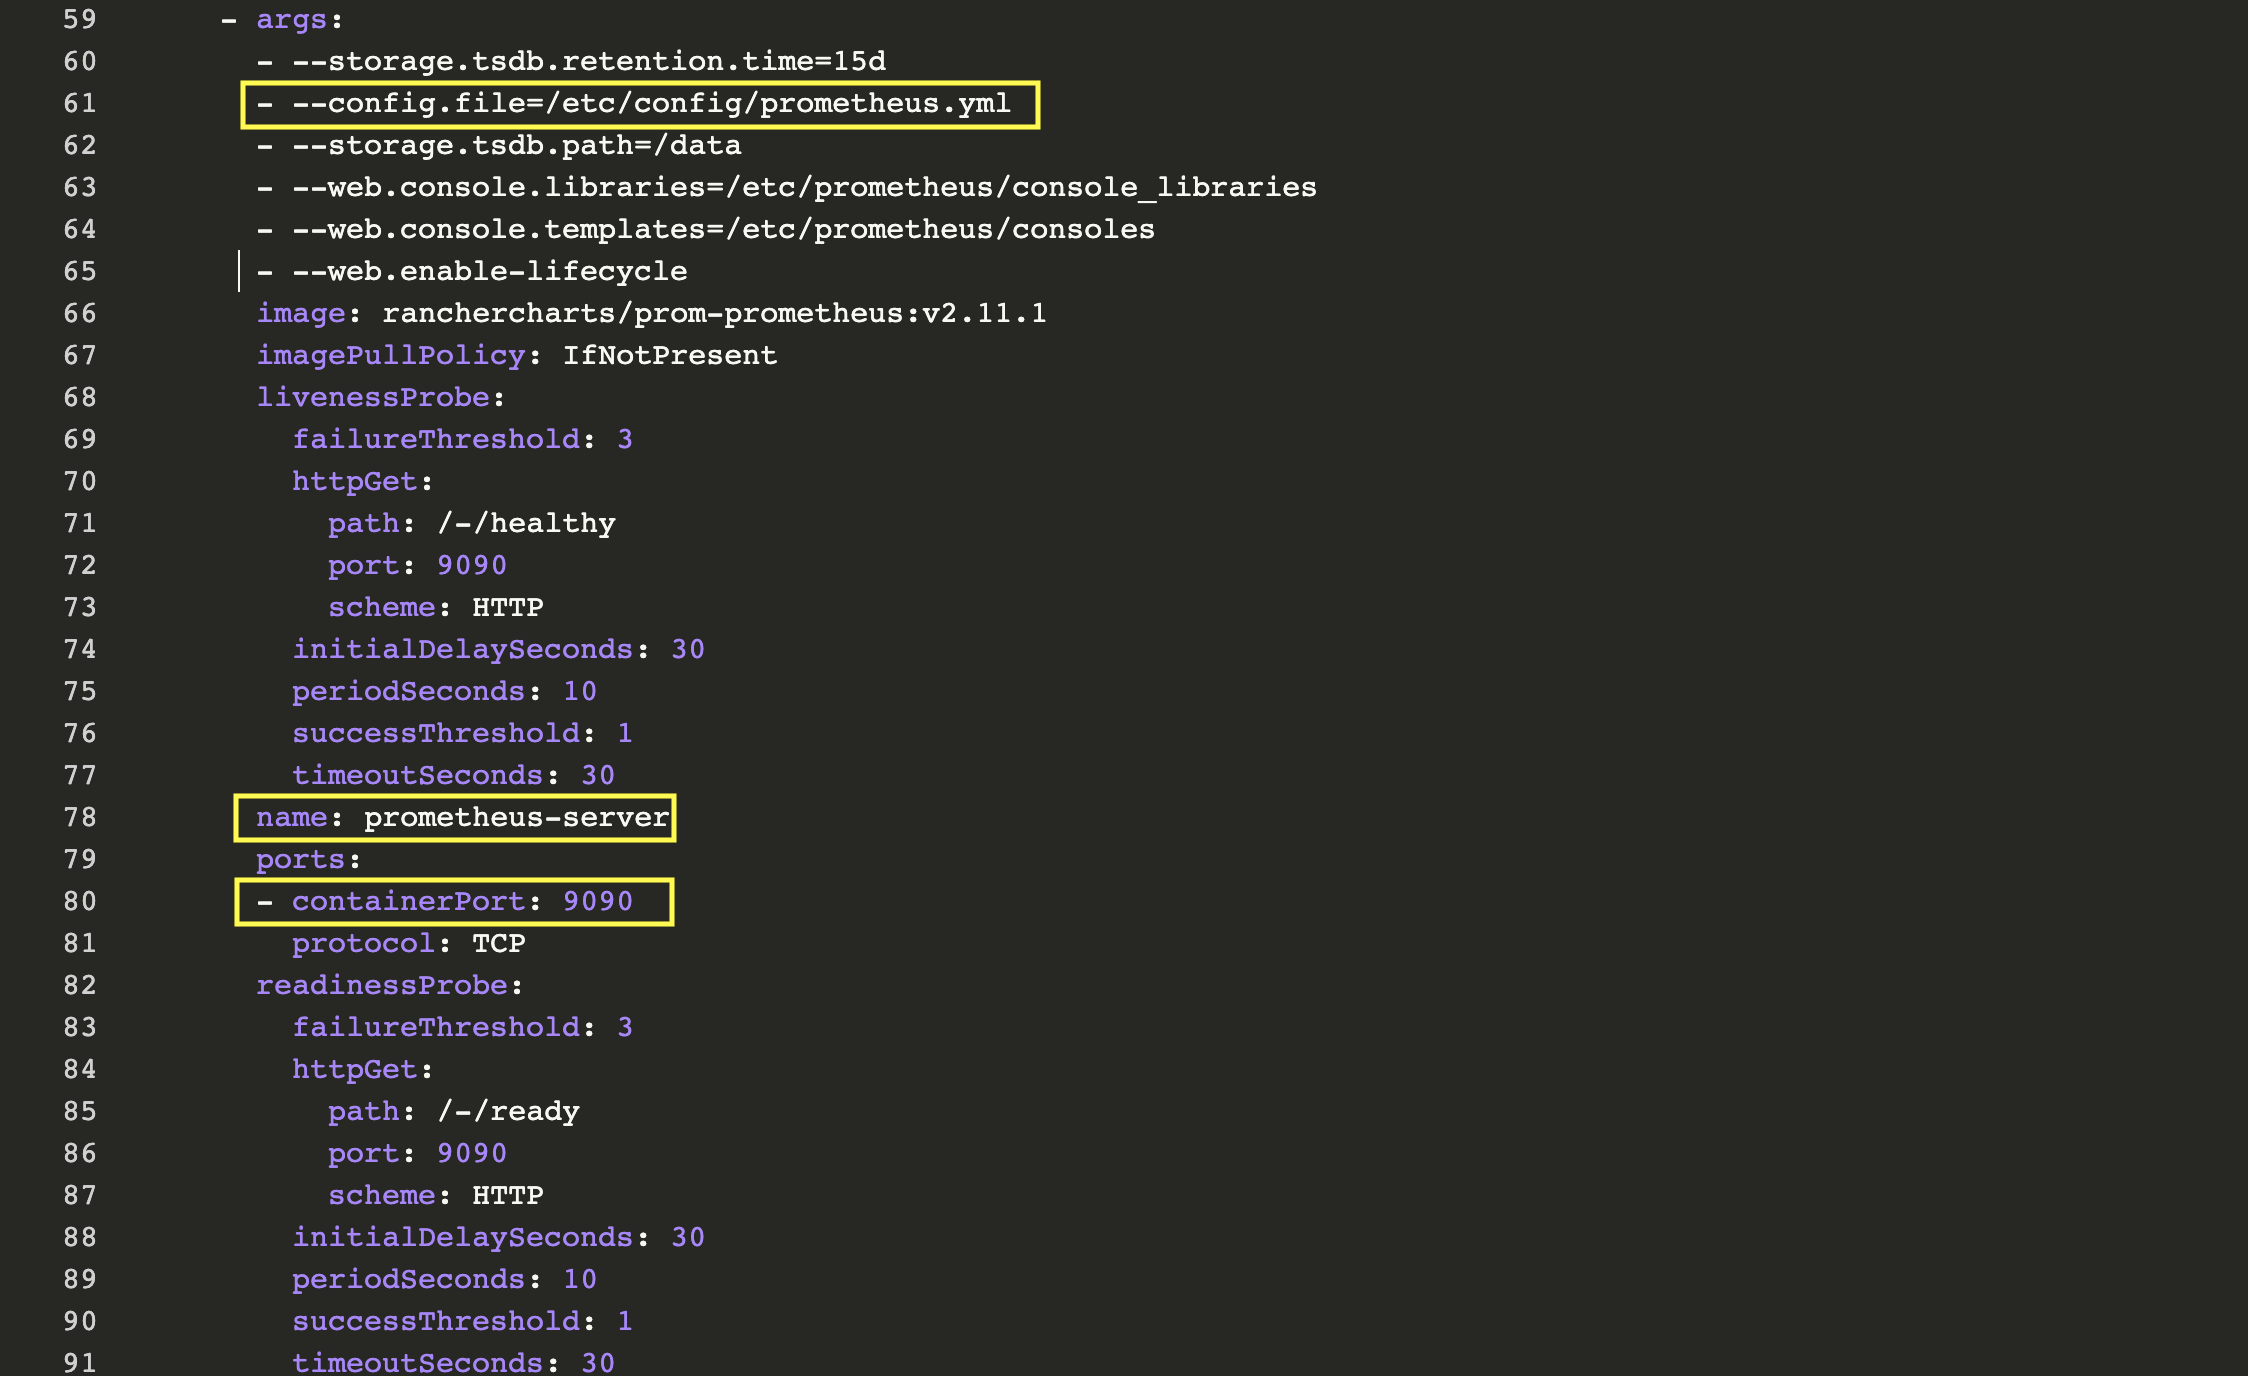
As we can see, Prometheus is configured through prometheus.yml. This file (and any others listed in serverFiles) will be mounted into the server pod. In order to add/edit rules, we will need to modify this file. This is in fact a Config Map, which can be found in Resources Config Tab. Click the vertical ellipsis (3 vertical dots) menu button and Edit. In the rules section, let’s add a few rules and click save.
groups:
  - name: memory demo alert
    rules:
      - alert: High Pod Memory
        expr: container_memory_usage_bytes{pod_name=~"nginx-.*", image!="", container!="POD"} > 5000000
        for: 1m
        labels:
          severity: critical
        annotations:
          summary: High Memory Usage

  - name: cpu demo alert
    rules:
      - alert: High Pod CPU
        expr: rate (container_cpu_usage_seconds_total{pod_name=~"nginx-.*", image!="", container!="POD"}[5m]) > 0.04
        for: 1m
        labels:
          severity: critical
        annotations:
          summary: High CPU Usage
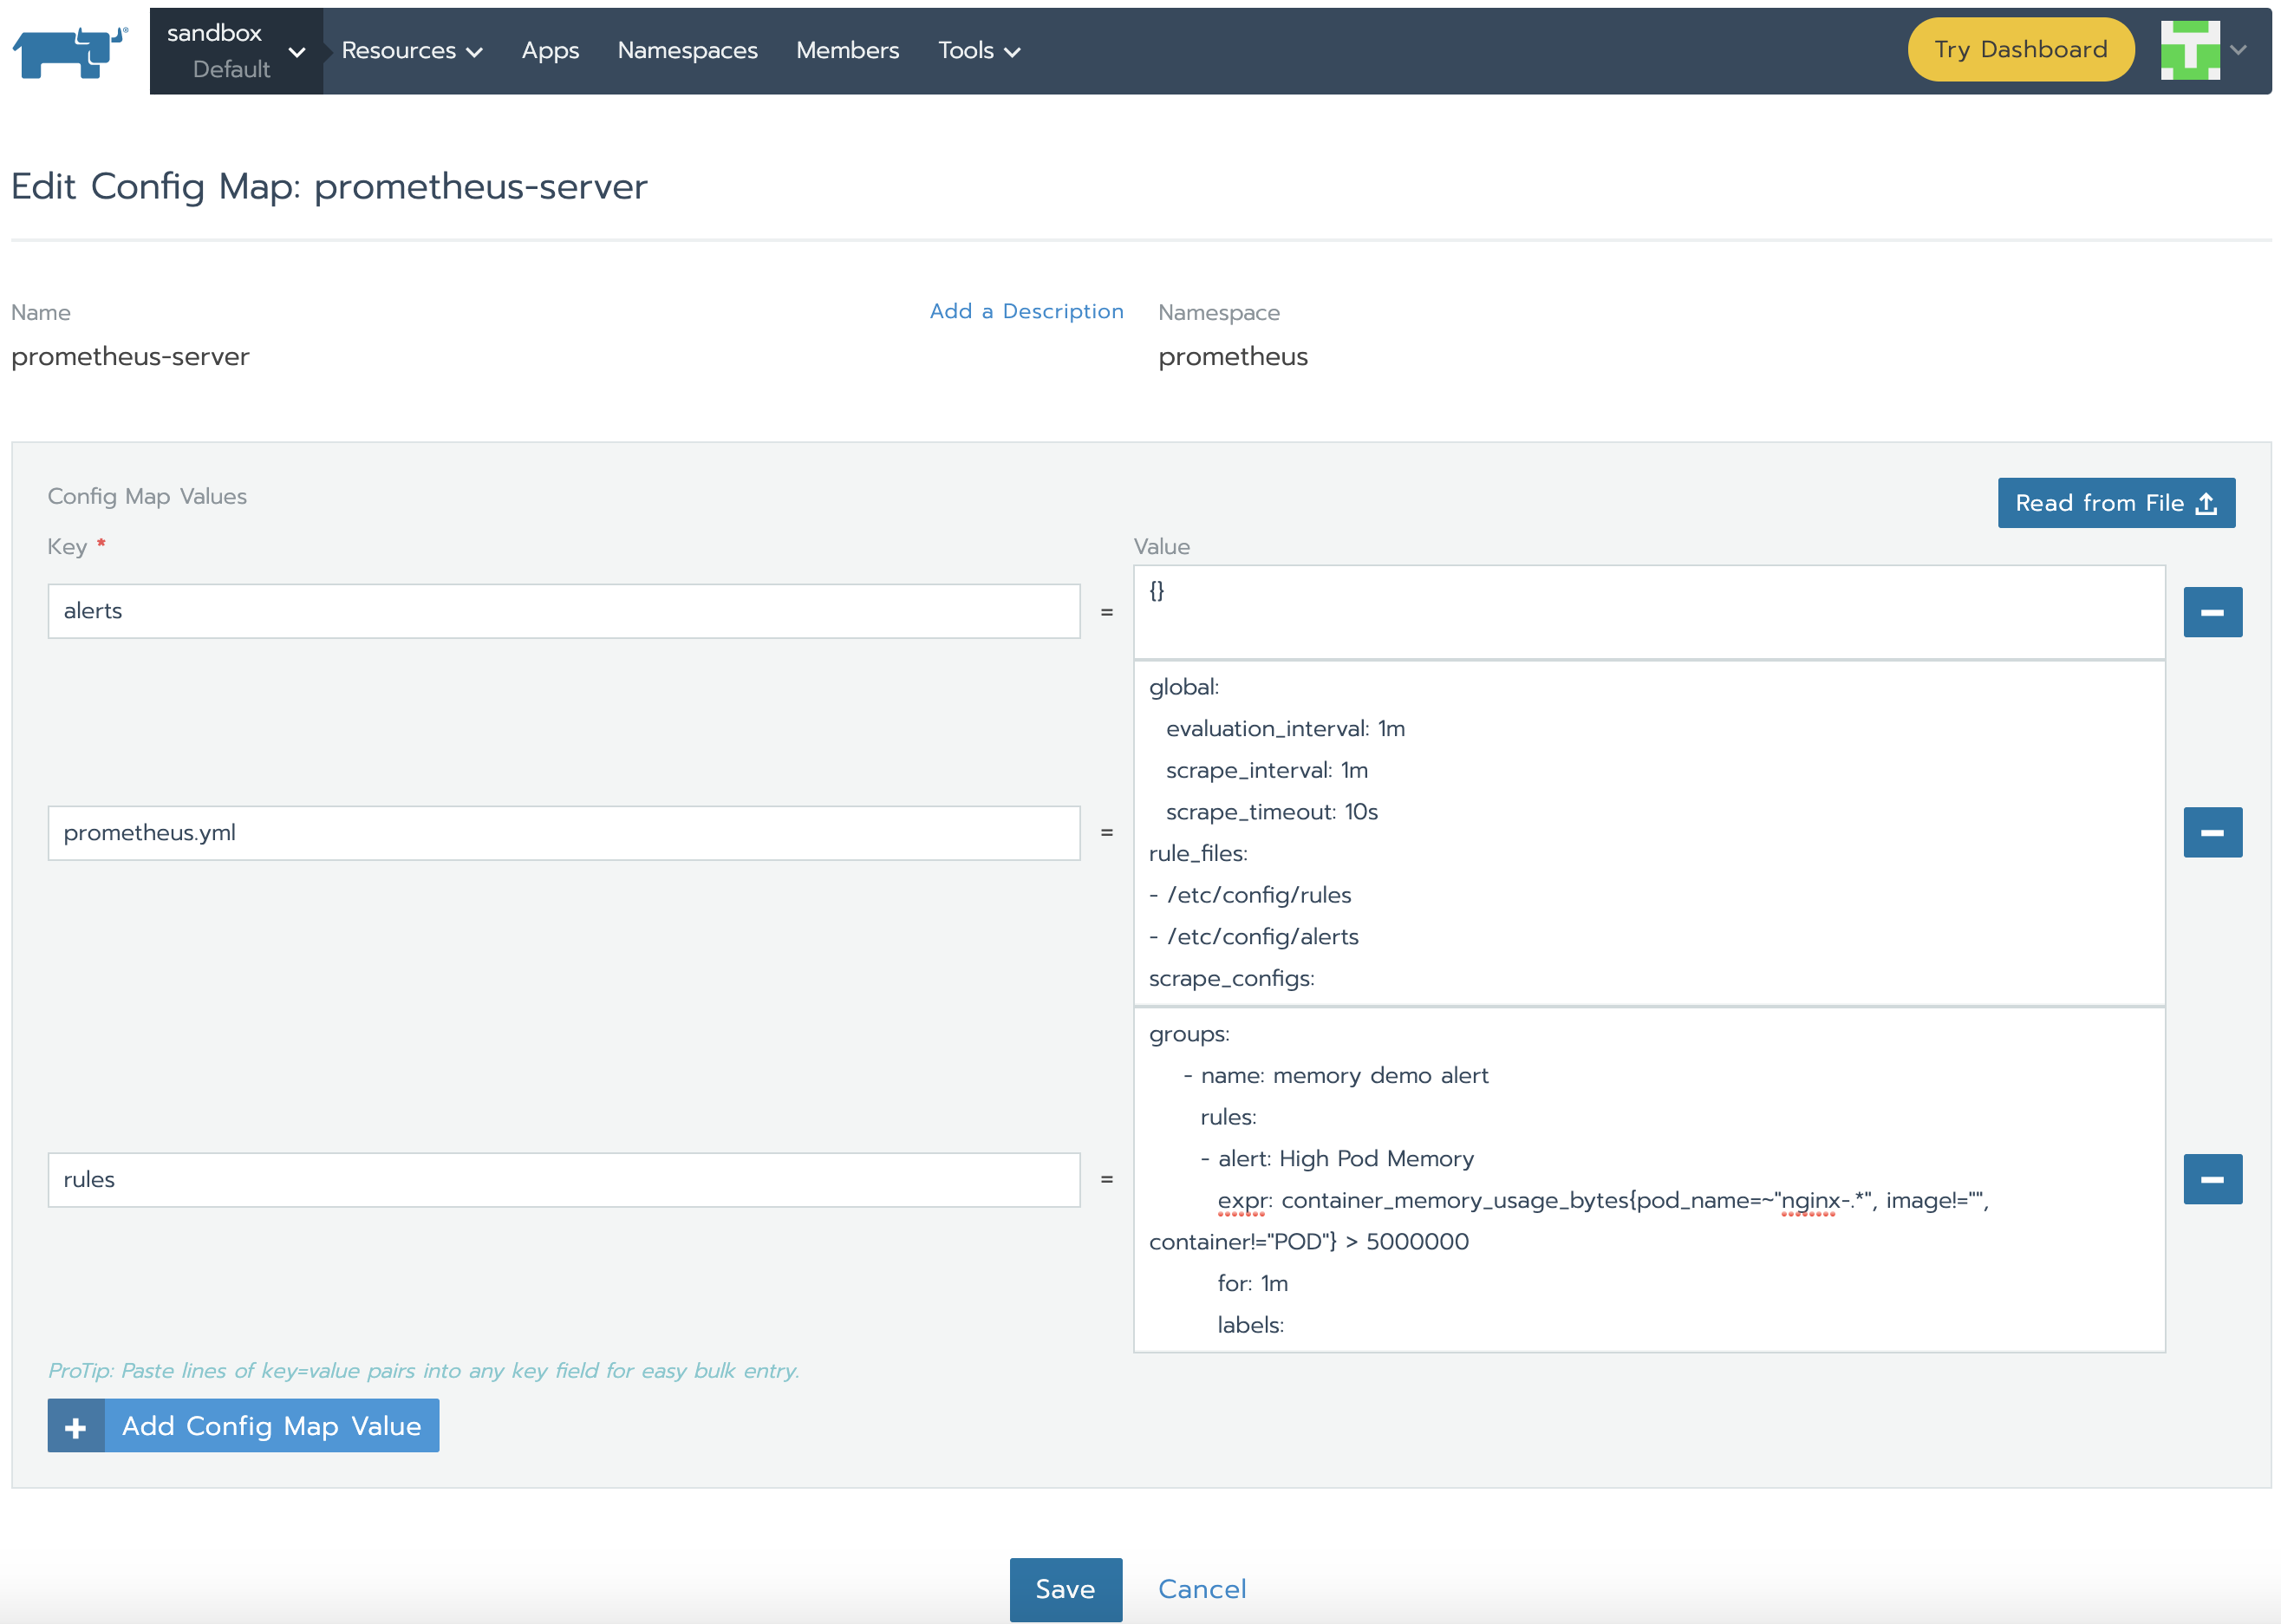
The rules are automatically loaded by Prometheus Server and we can see them right away in the Prometheus server GUI:

Here is an explanation about the two rules above:
- container_memory_usage_bytes: current memory usage in bytes, including all memory regardless of when it was accessed
- container_cpu_usage_seconds_total: cumulative cpu time consumed in seconds.
All the metrics can be found here.
All regular expressions in Prometheus use RE2 syntax. Using regular expressions, we can select time series only for pods whose names match a certain pattern. In our case, we look for pods that start with nginx- and exclude “POD” as this is the parent cgroup for the container and will show stats for all containers inside the pod.
For container_cpu_usage_seconds_total, we use what it is called a Subquery. This returns the 5-minute rate of our metric.
More info about queries and some examples can be found on the official Prometheus documentation page.
Alerts
Alerts can notify us as soon as a problem occurs, so we’ll know immediately when something goes wrong with our system. Prometheus provides alerting via its Alertmanager component.
We can follow the same steps as for Prometheus Server. Under the Resources -> Workload tab, go to prometheus-alertmanager View/Edit YAML under vertical ellipsis (3 vertical dots) menu button to check its configuration.
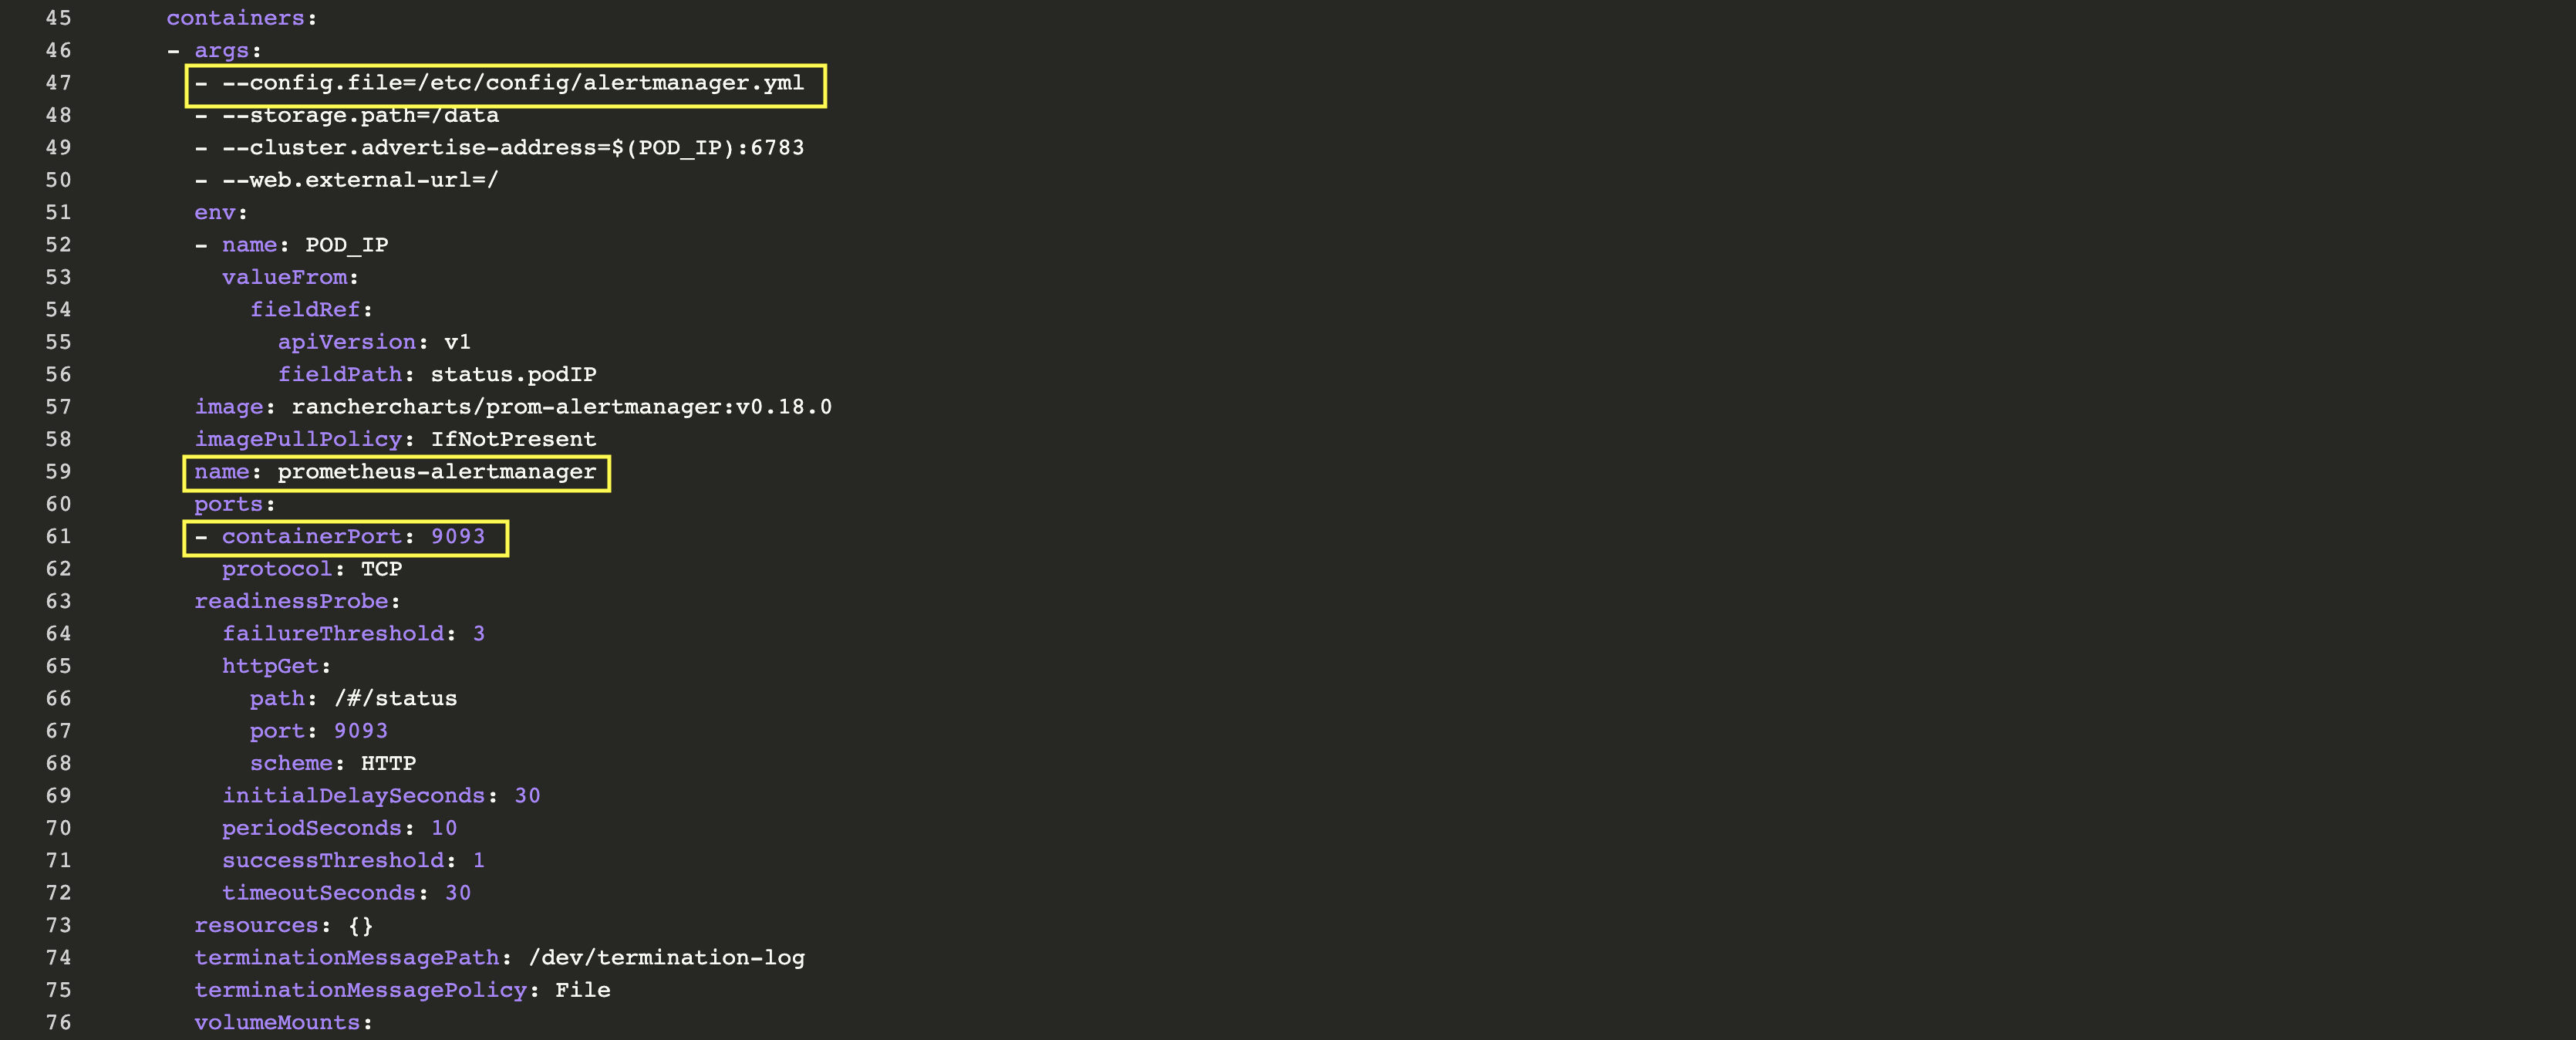
Alertmanager is configured through alertmanager.yml. This file (and any others listed in alertmanagerFiles) will be mounted into the alertmanager pod. In order to set up alerting we need to modify the configMap associated to alertmanager. Under
Config tag, click the vertical ellipsis on prometheus-alertmanager line and then Edit. Replace the basic configuration with the following:
global:
  resolve_timeout: 5m
route:
  group_by: [Alertname]
  # Send all notifications to me.
  receiver: demo-alert
  group_wait: 30s
  group_interval: 5m
  repeat_interval: 12h
  routes:
    - match:
        alertname: DemoAlertName
      receiver: "demo-alert"

receivers:
  - name: demo-alert
    email_configs:
      - to: your_email@gmail.com
        from: from_email@gmail.com
        # Your smtp server address
        smarthost: smtp.gmail.com:587
        auth_username: from_email@gmail.com
        auth_identity: from_email@gmail.com
        auth_password: 16letter_generated token # you can use gmail account password, but better create a dedicated token for this
        headers:
          From: from_email@gmail.com
          Subject: "Demo ALERT"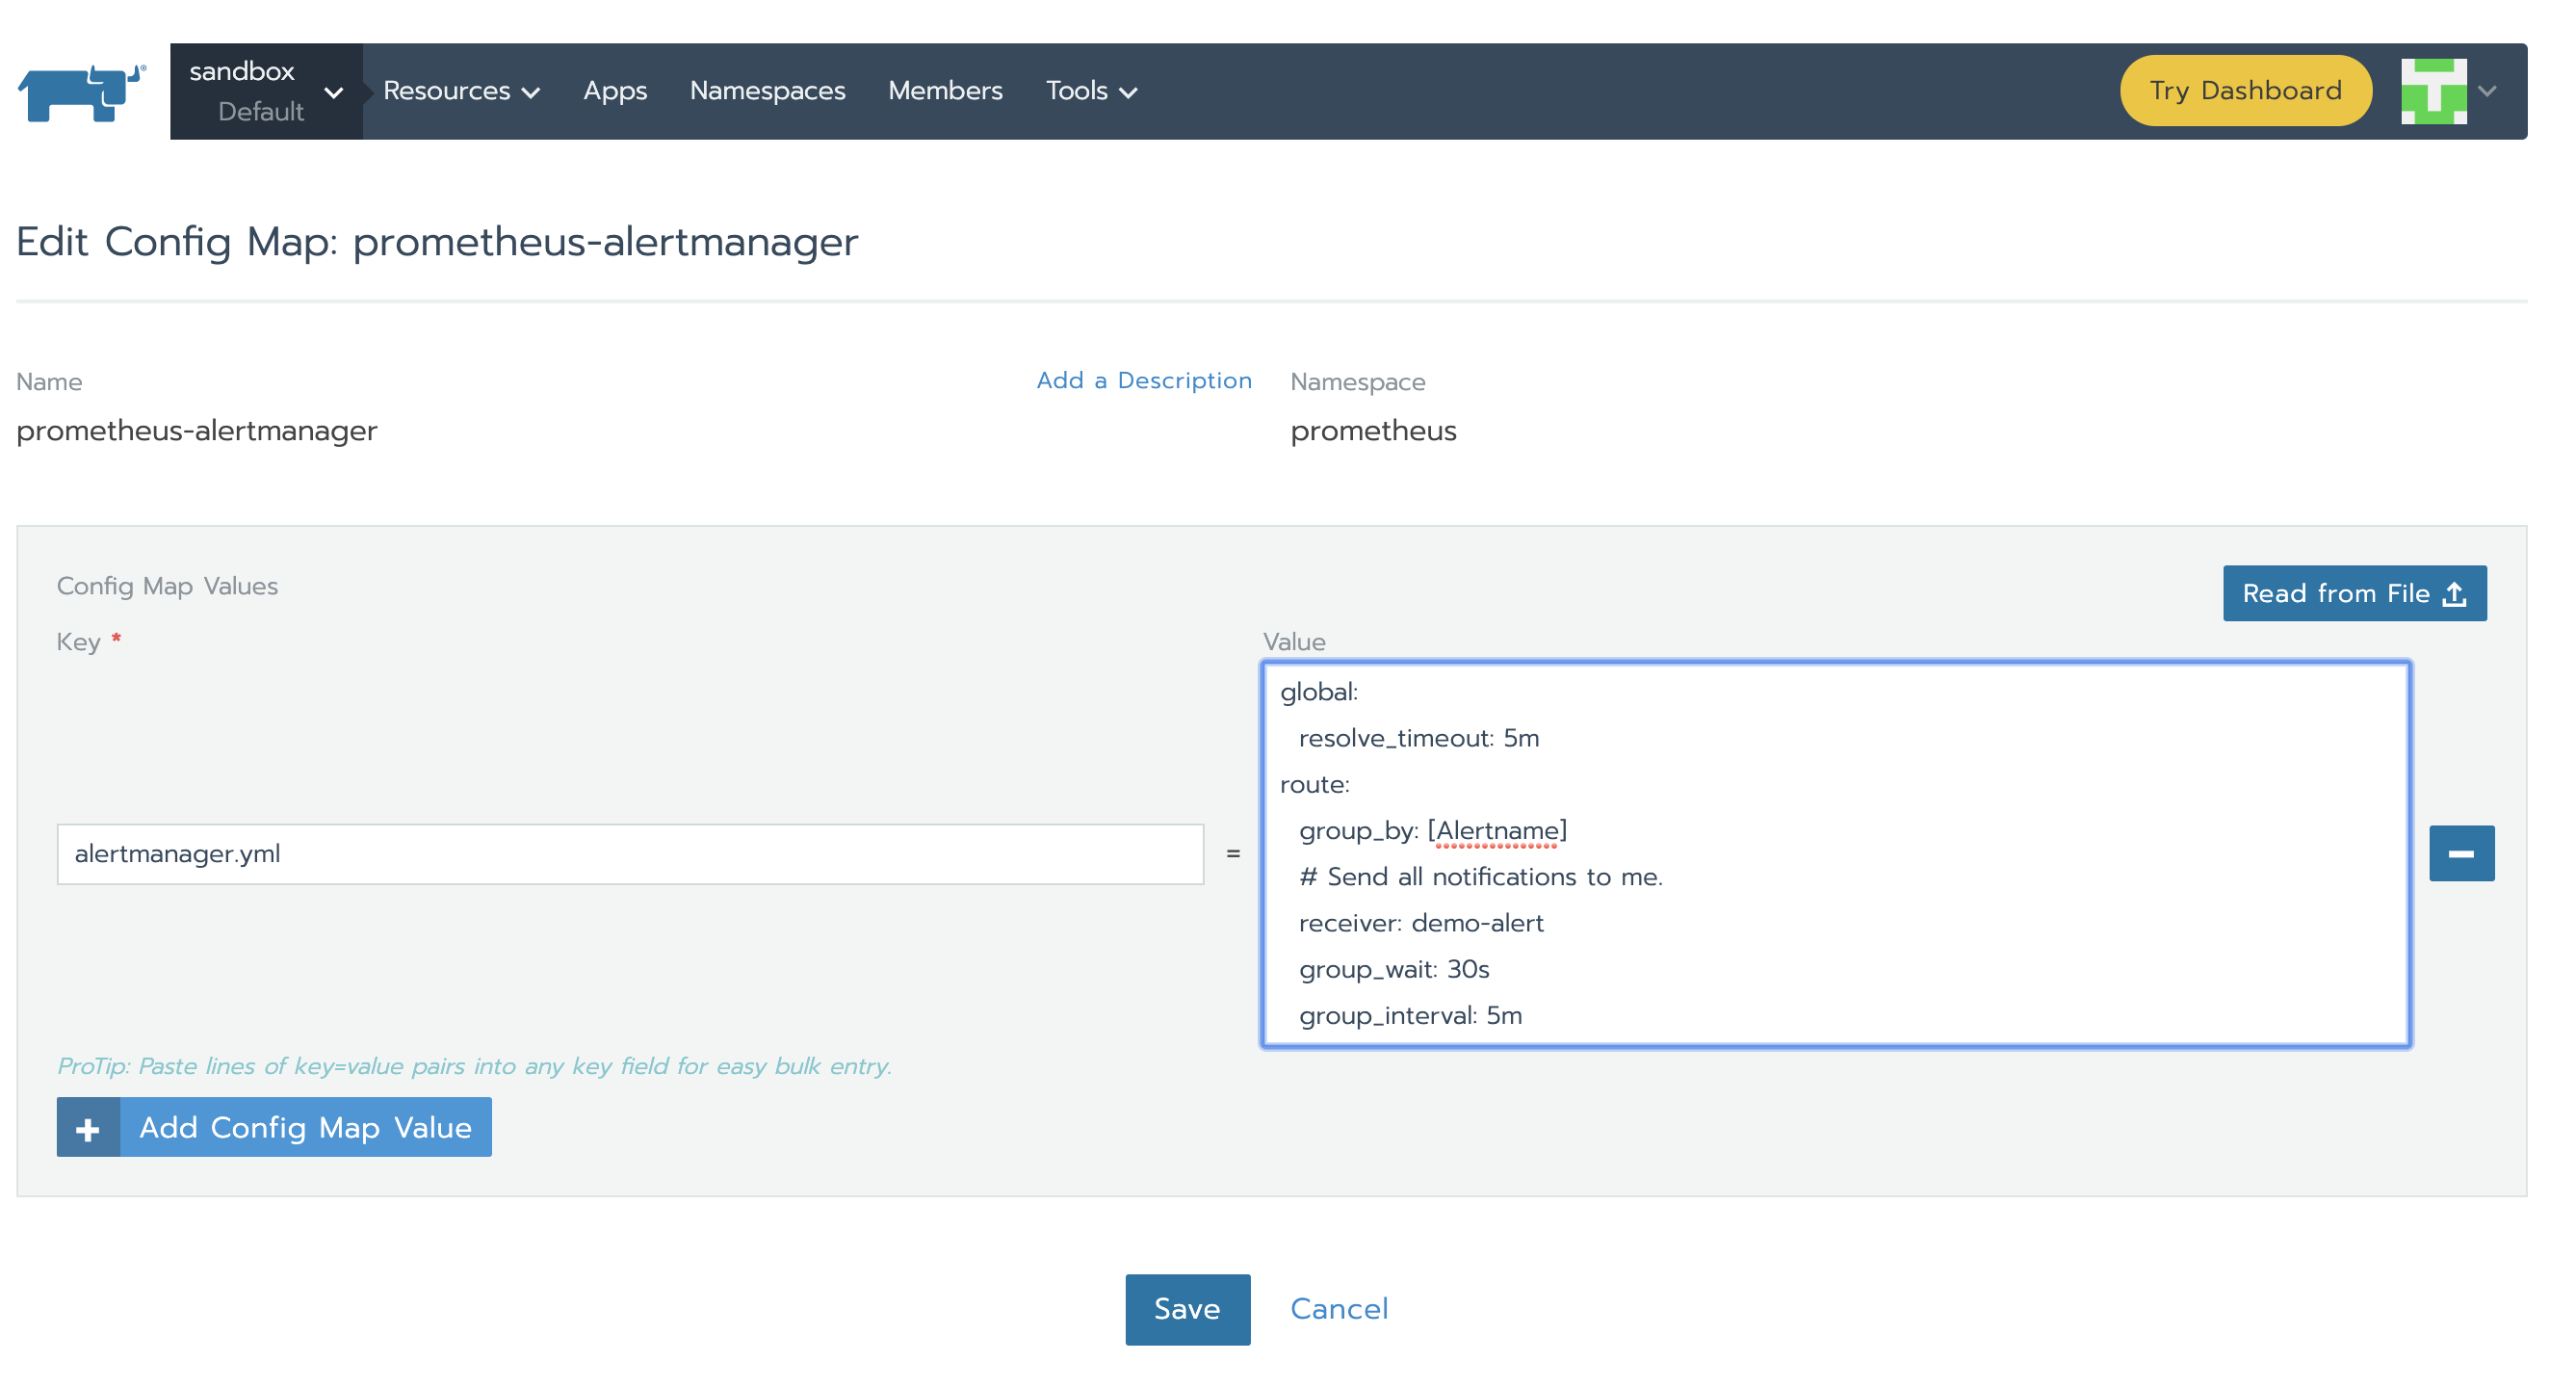
The new configuration is automatically reloaded by Alertmanager and we can see it right away in the GUI under Status tab.
Testing an End-to-End Scenario
Let’s deploy something to monitor. A simple nginx deployment should be enough for this exercise. Using Rancher GUI, under the Resources -> Workload Tab click Import YAML, paste the code below (use the default namespace this time) and hit Import.
apiVersion: apps/v1 # for versions before 1.9.0 use apps/v1beta2
kind: Deployment
metadata:
  name: nginx-deployment
spec:
  selector:
    matchLabels:
      app: nginx
  replicas: 3 # tells deployment to run 2 pods matching the template
  template:
    metadata:
      labels:
        app: nginx
    spec:
      containers:
        - name: nginx
          image: nginx:1.7.9
          ports:
            - containerPort: 80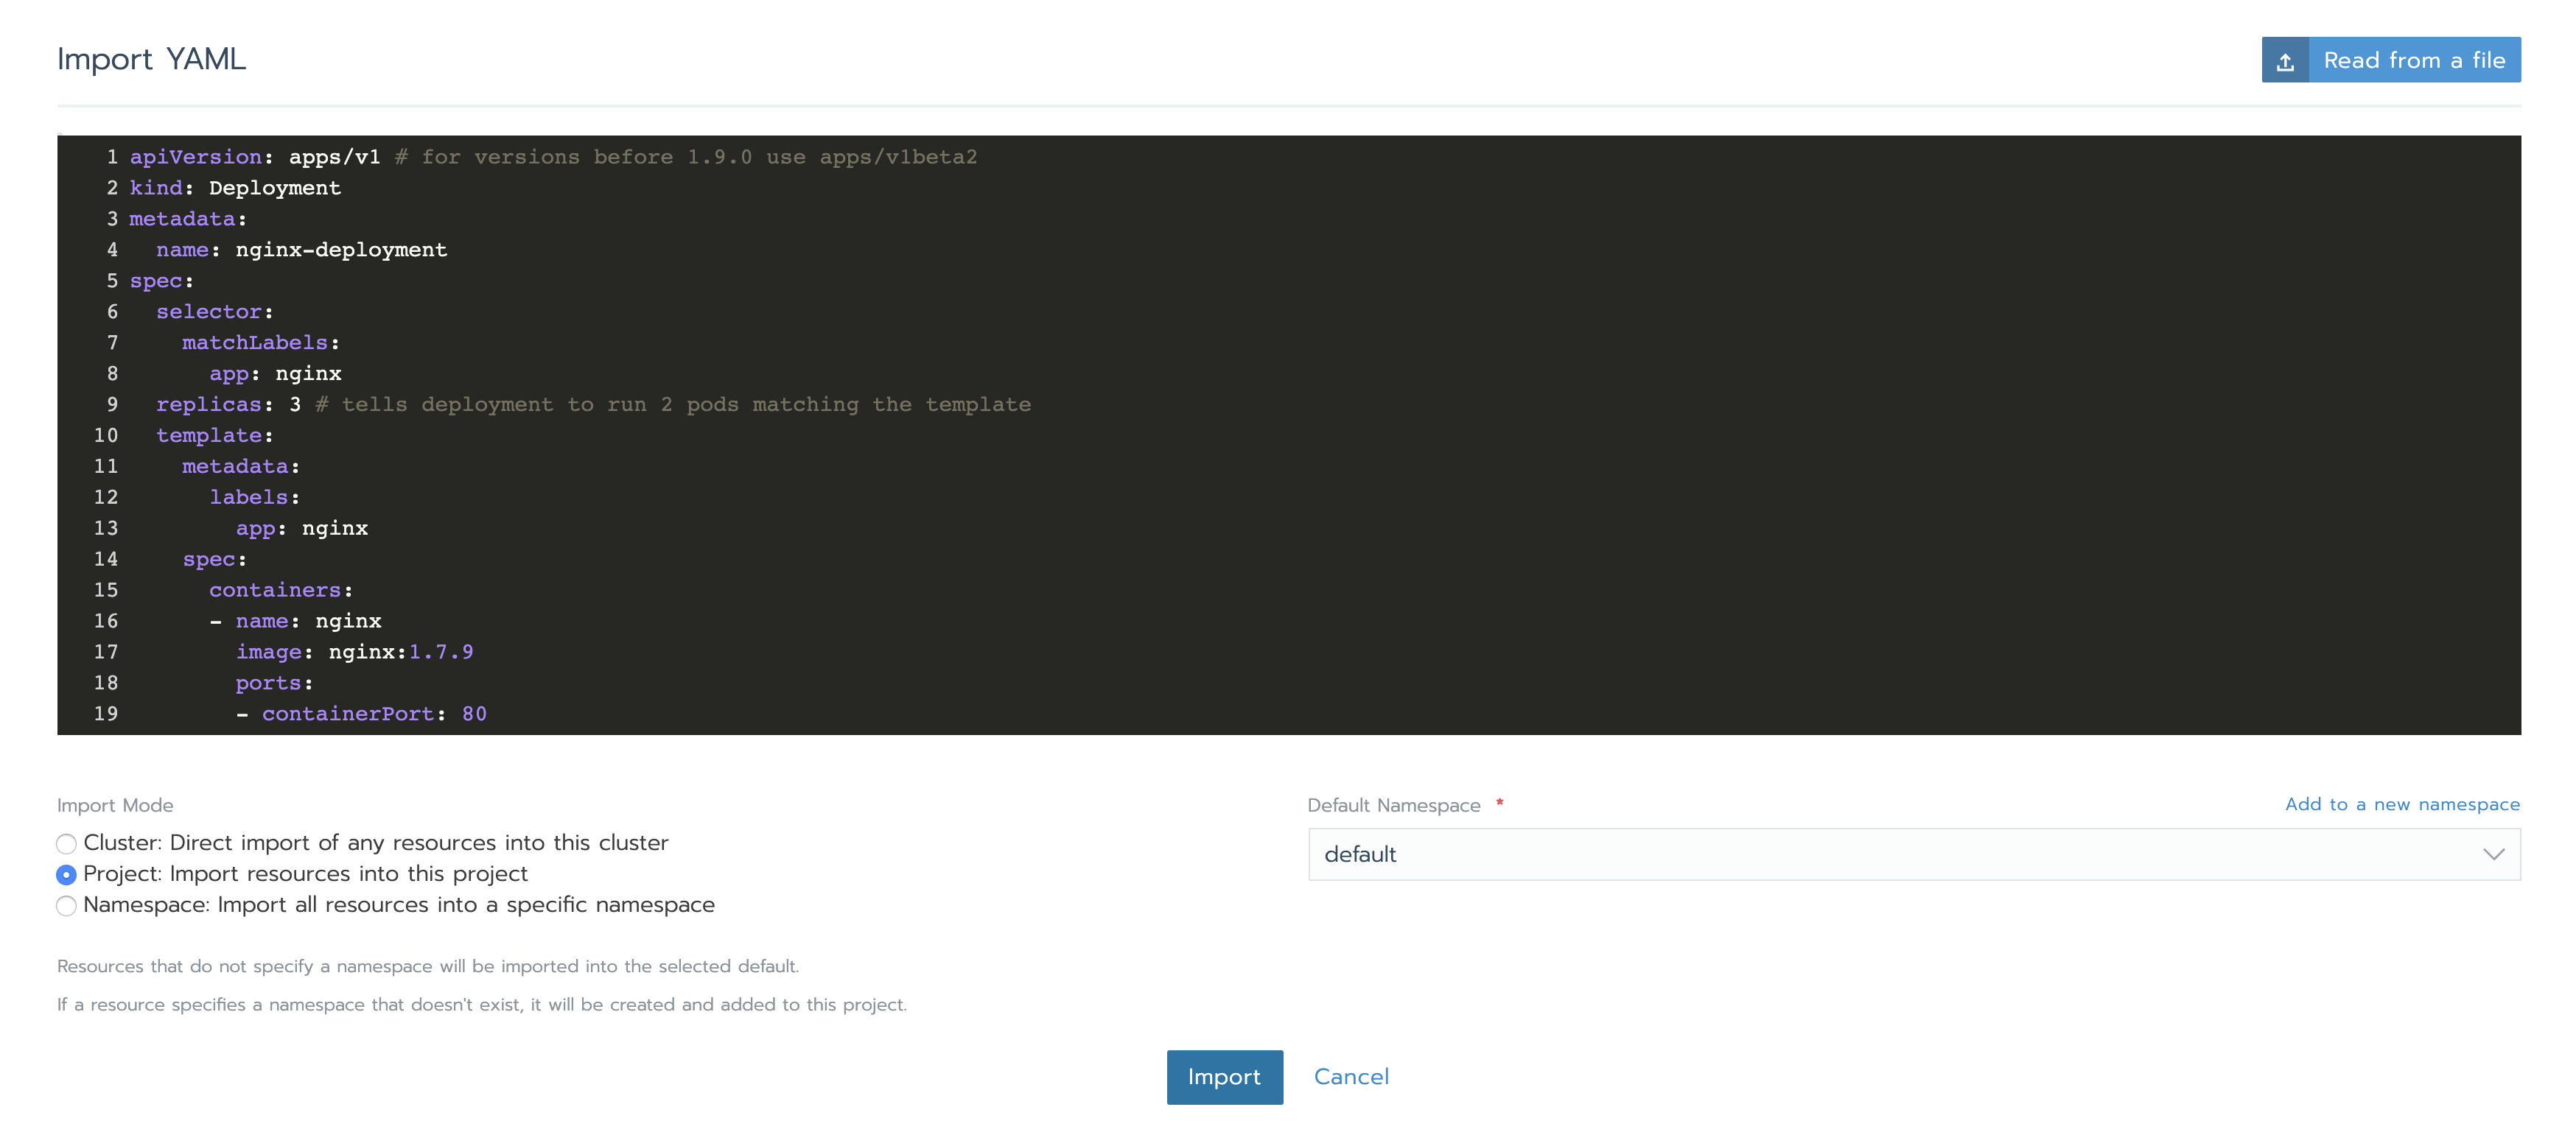
In the Prometheus UI, we can use one of the two expressions we configured for alerts to see some metrics:
rate (container_cpu_usage_seconds_total{pod_name=~"nginx-.*", image!="", container!="POD"}[5m])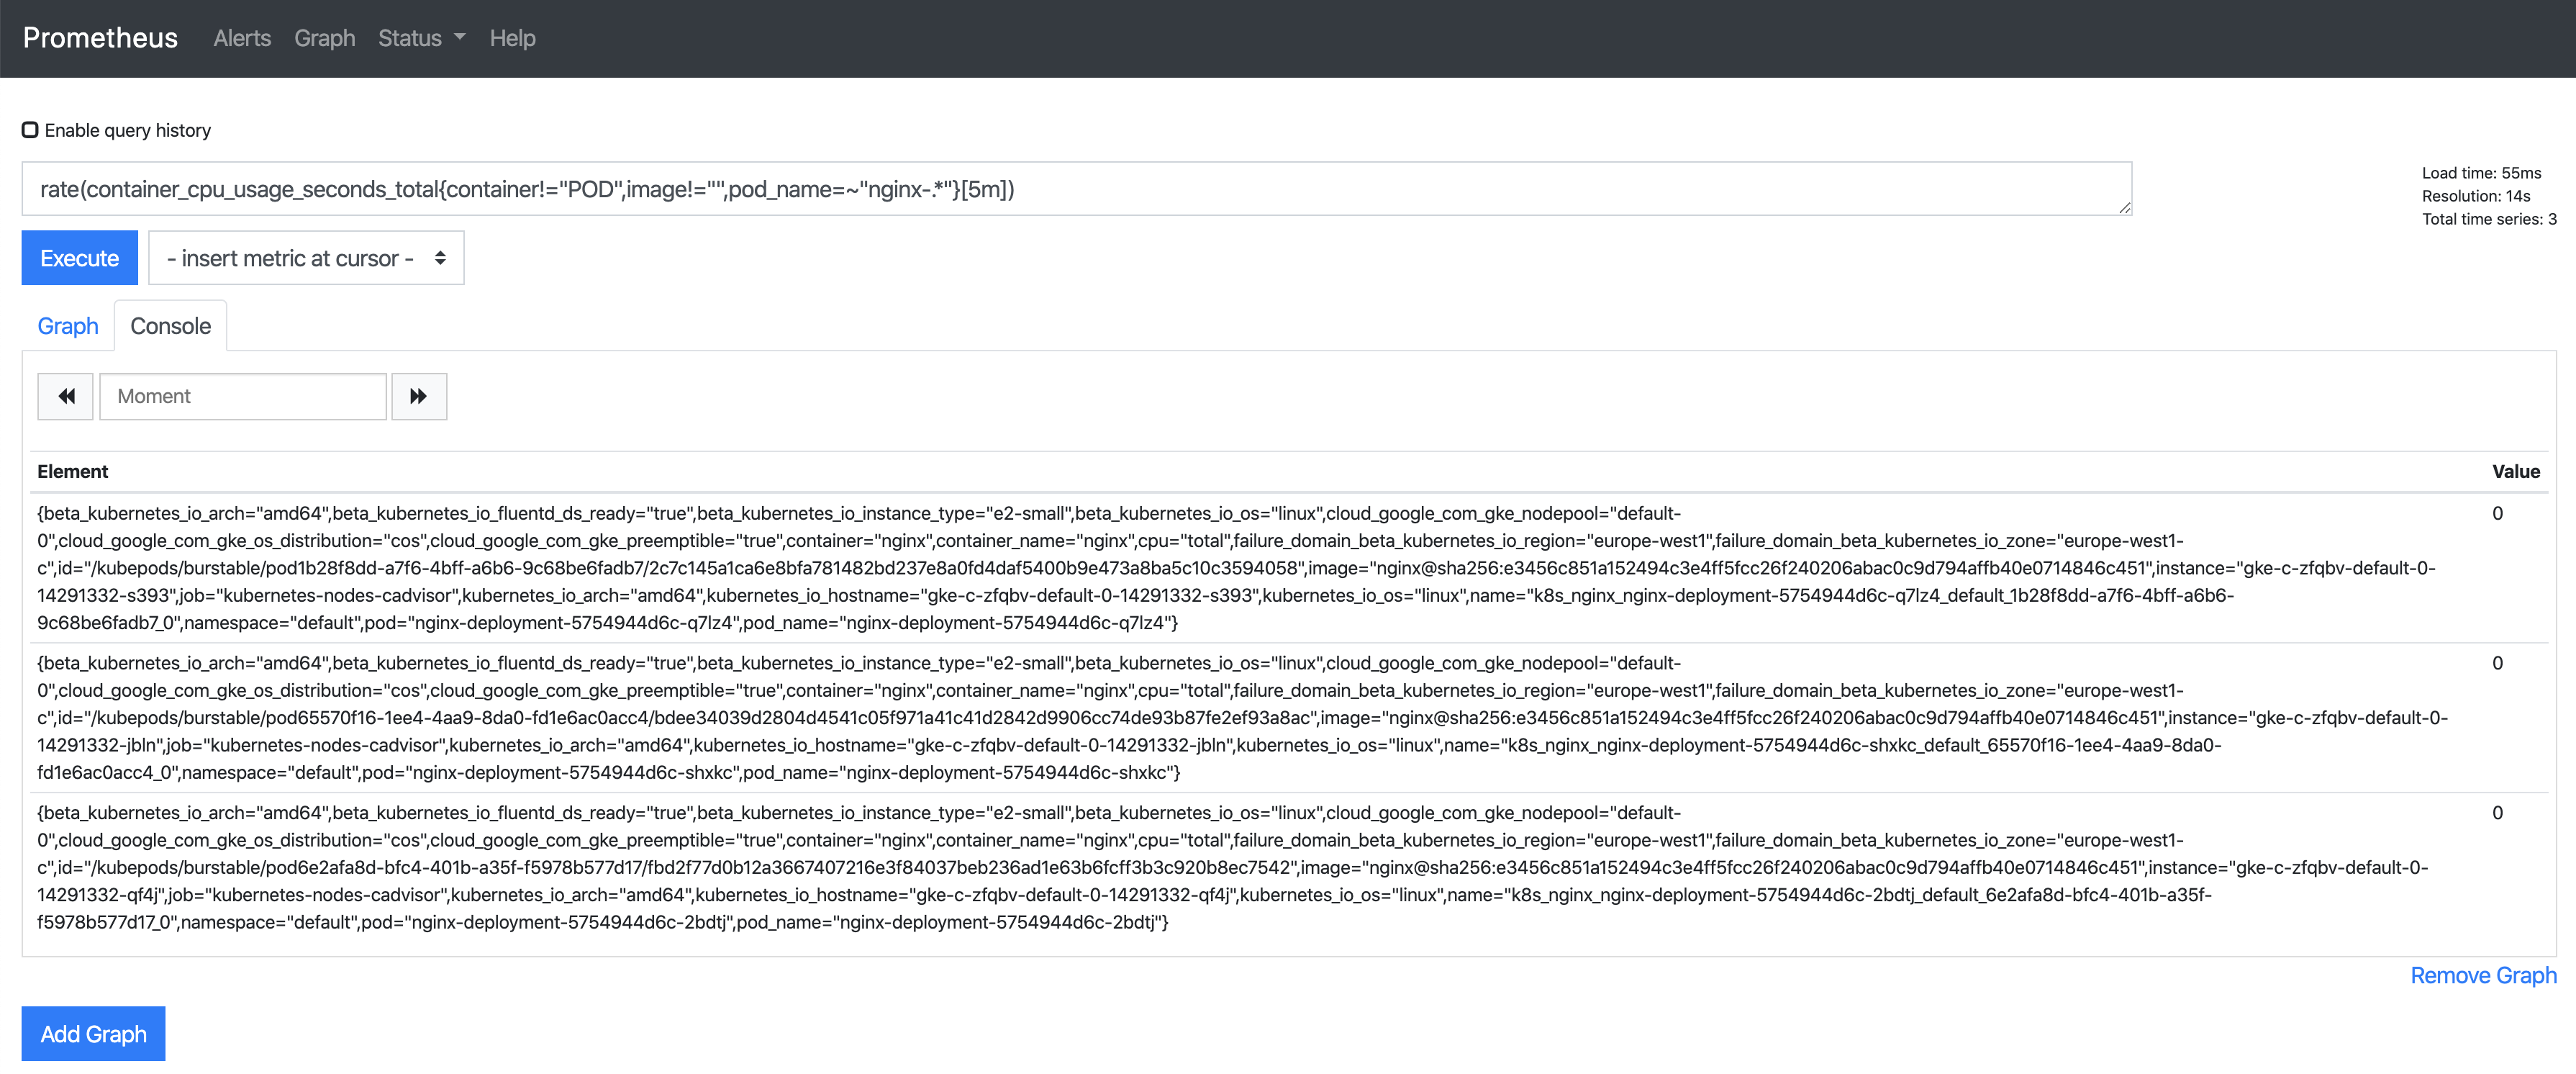
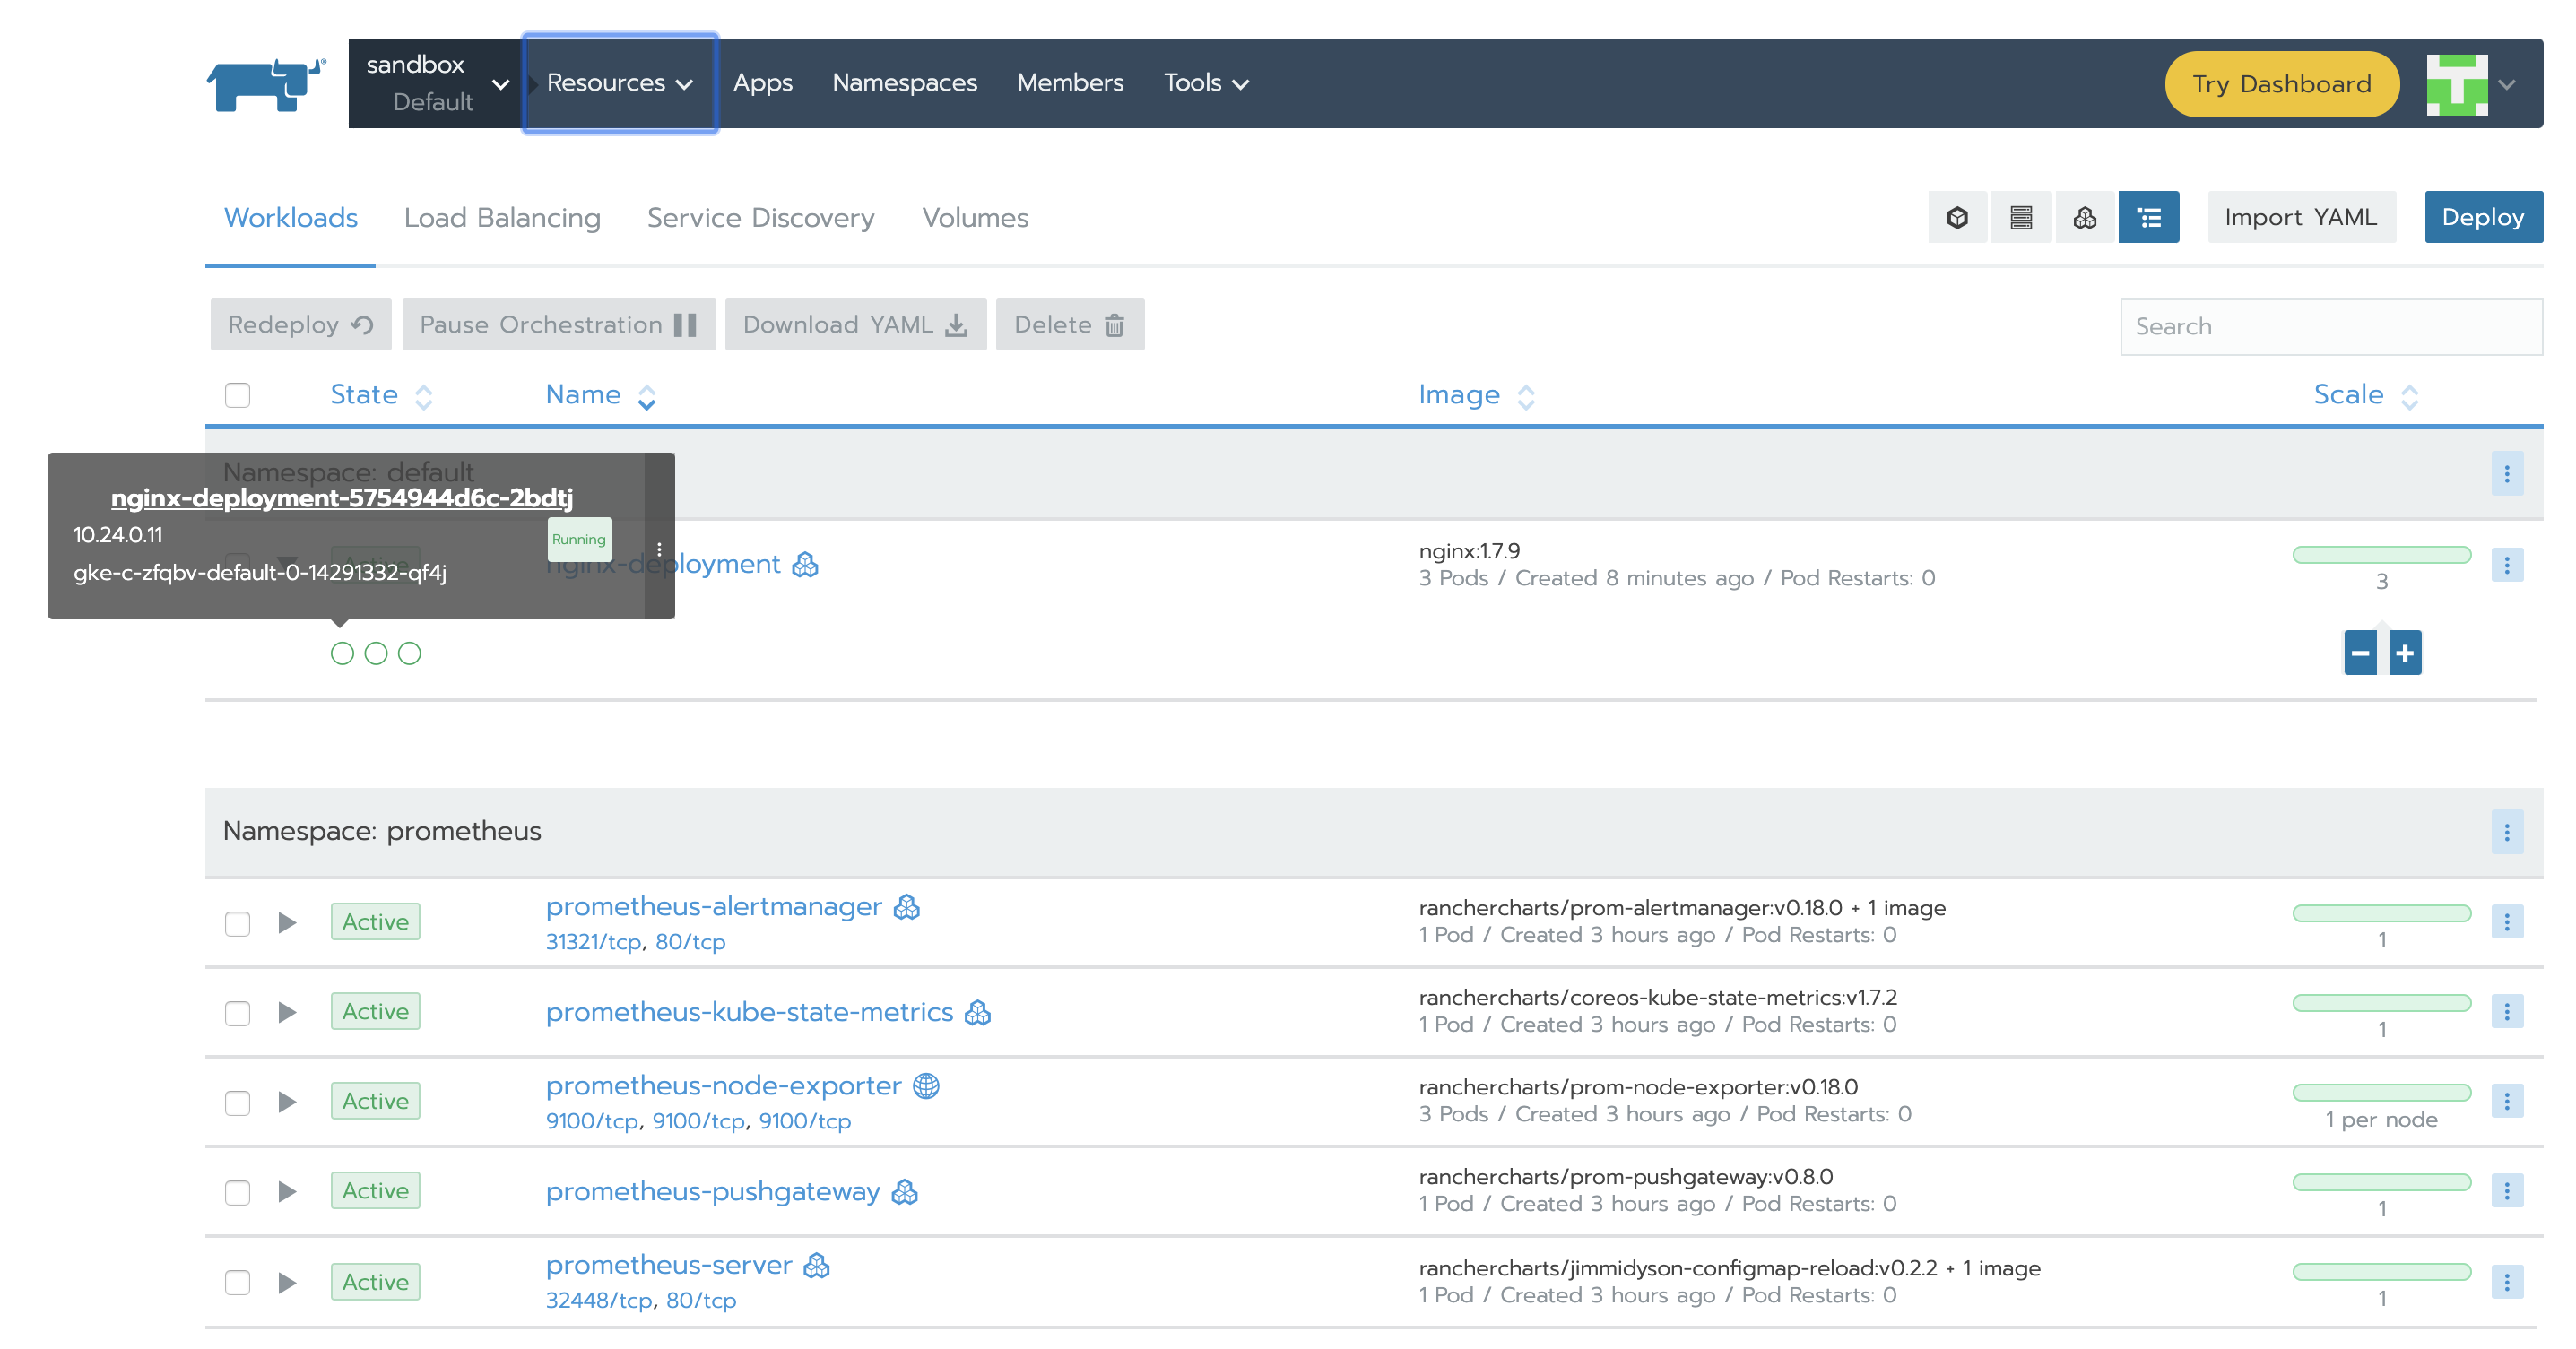
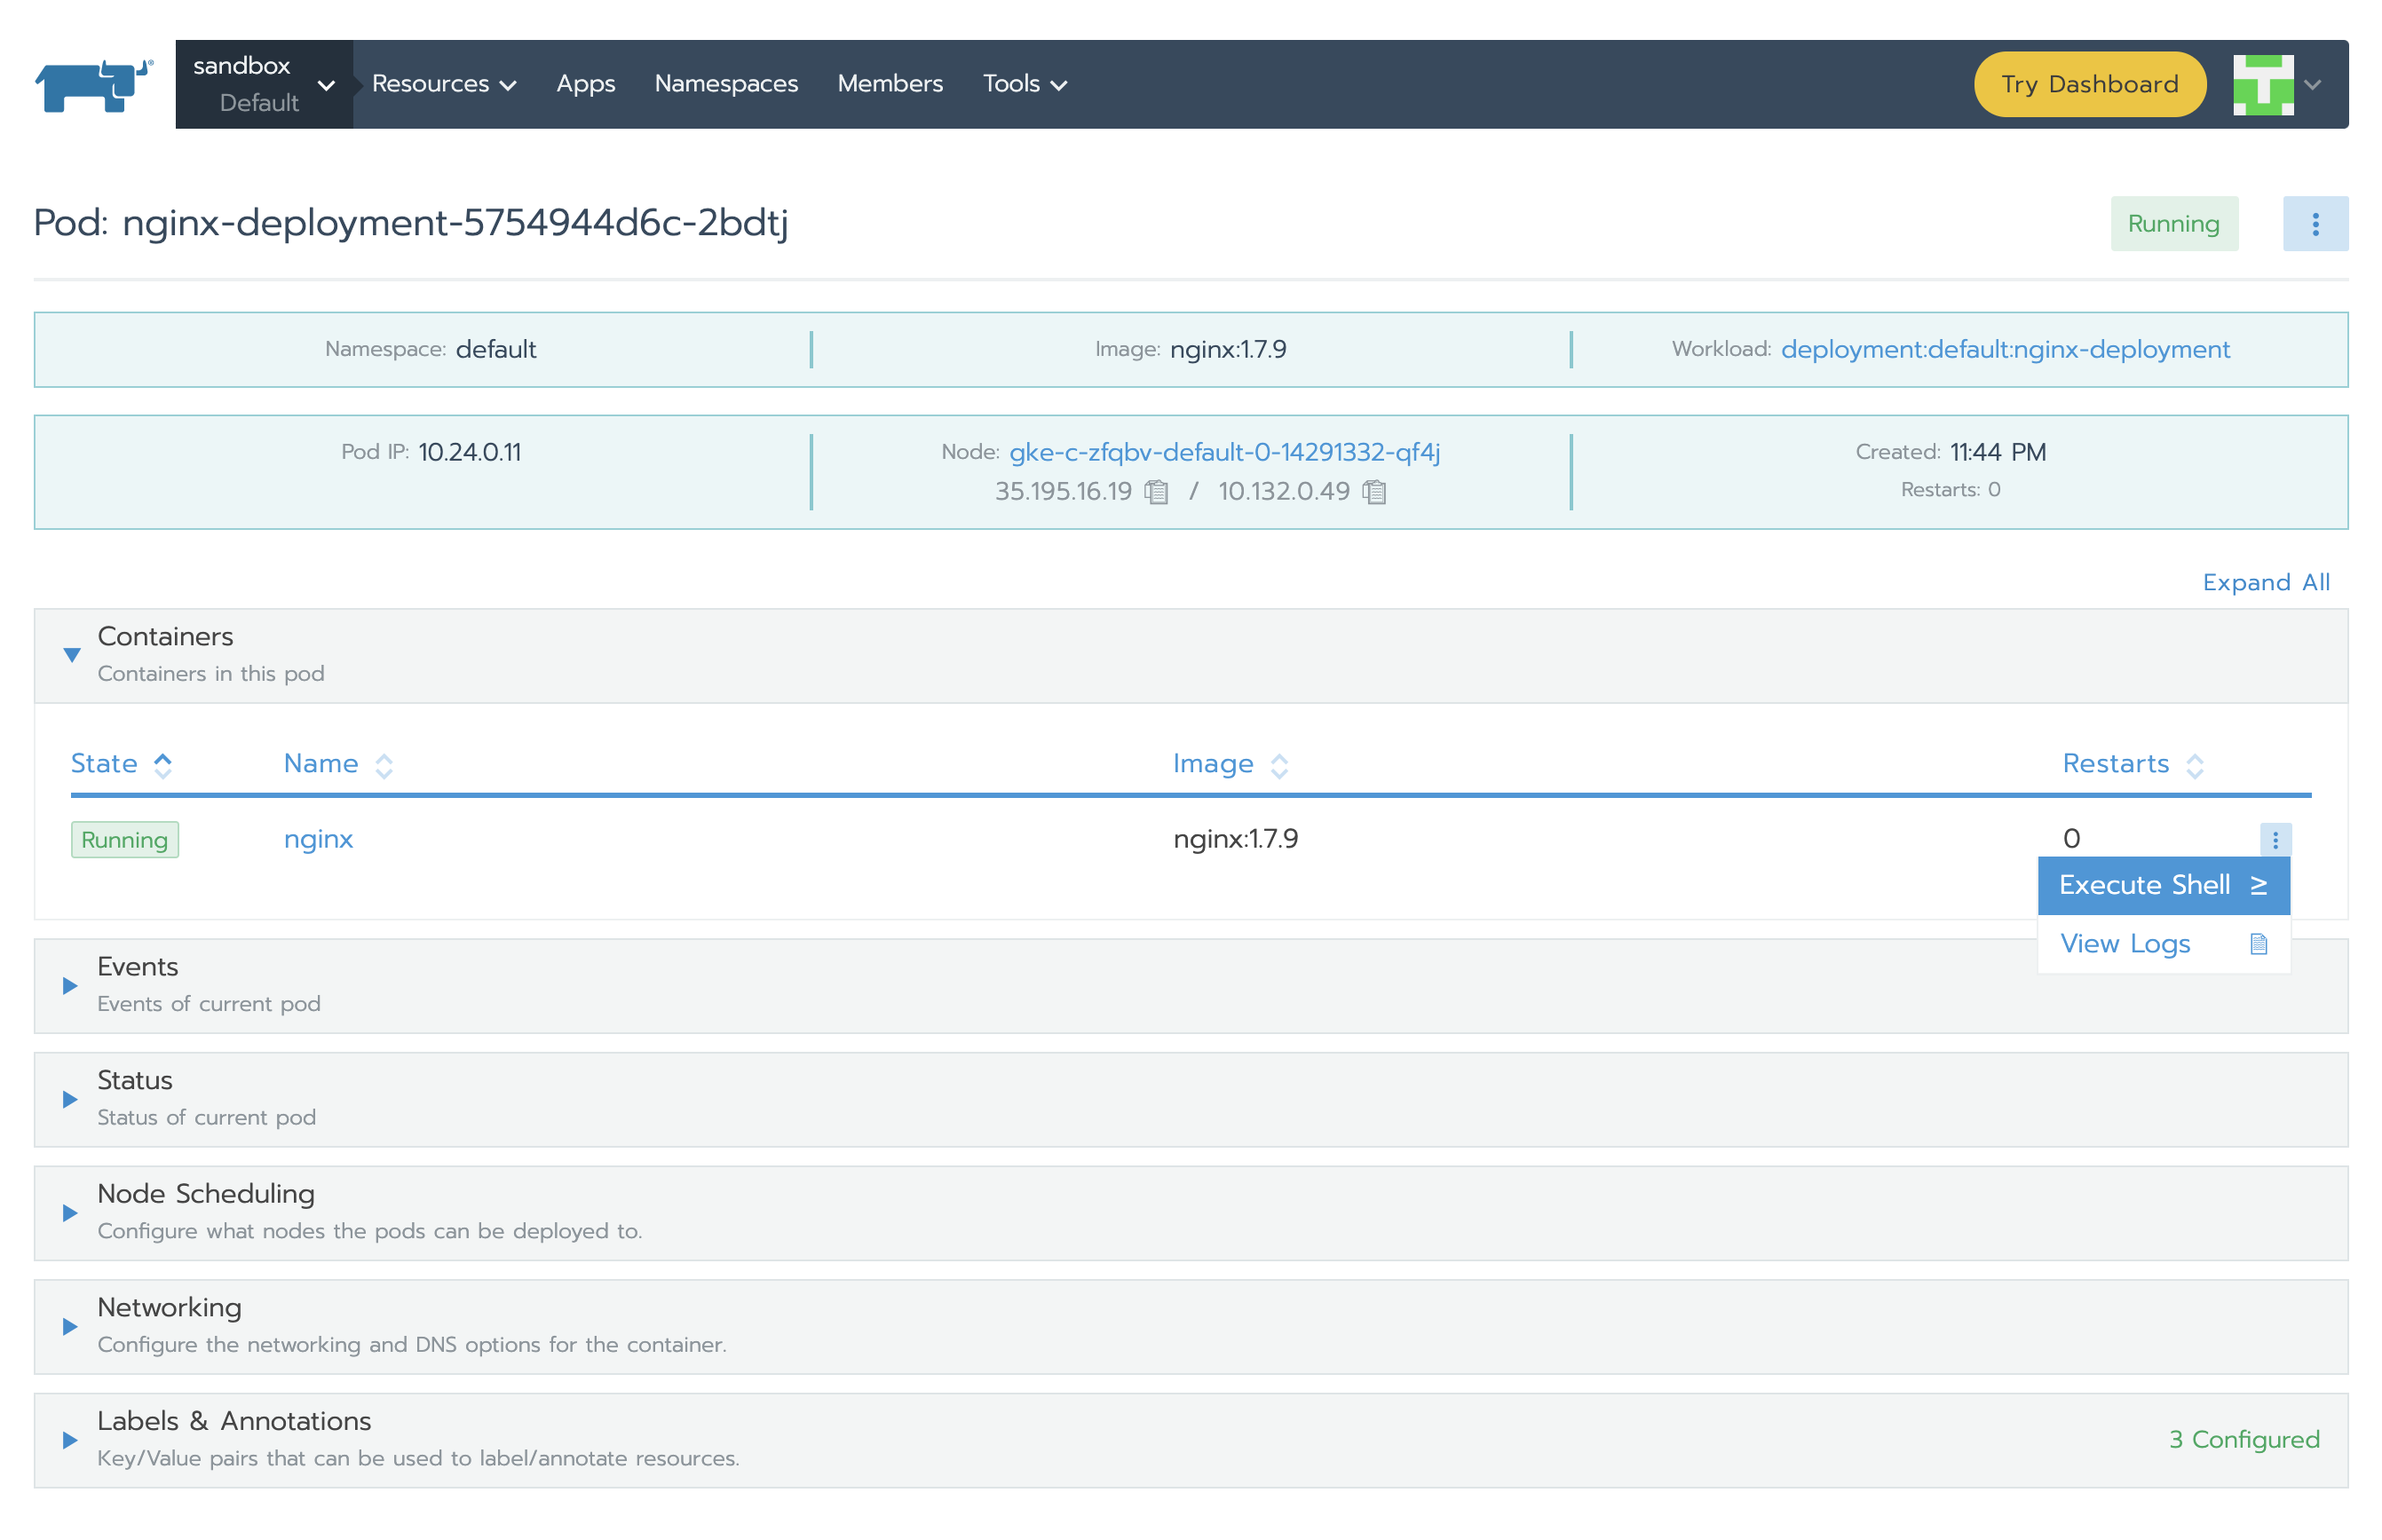
Let’s put some load in one of the pods to see the value change. When the value is greater than 0.04, we should have an alert. For this we need to select one of the nginx Deployment Pods and click Execute Shell. Inside it we will execute a command:

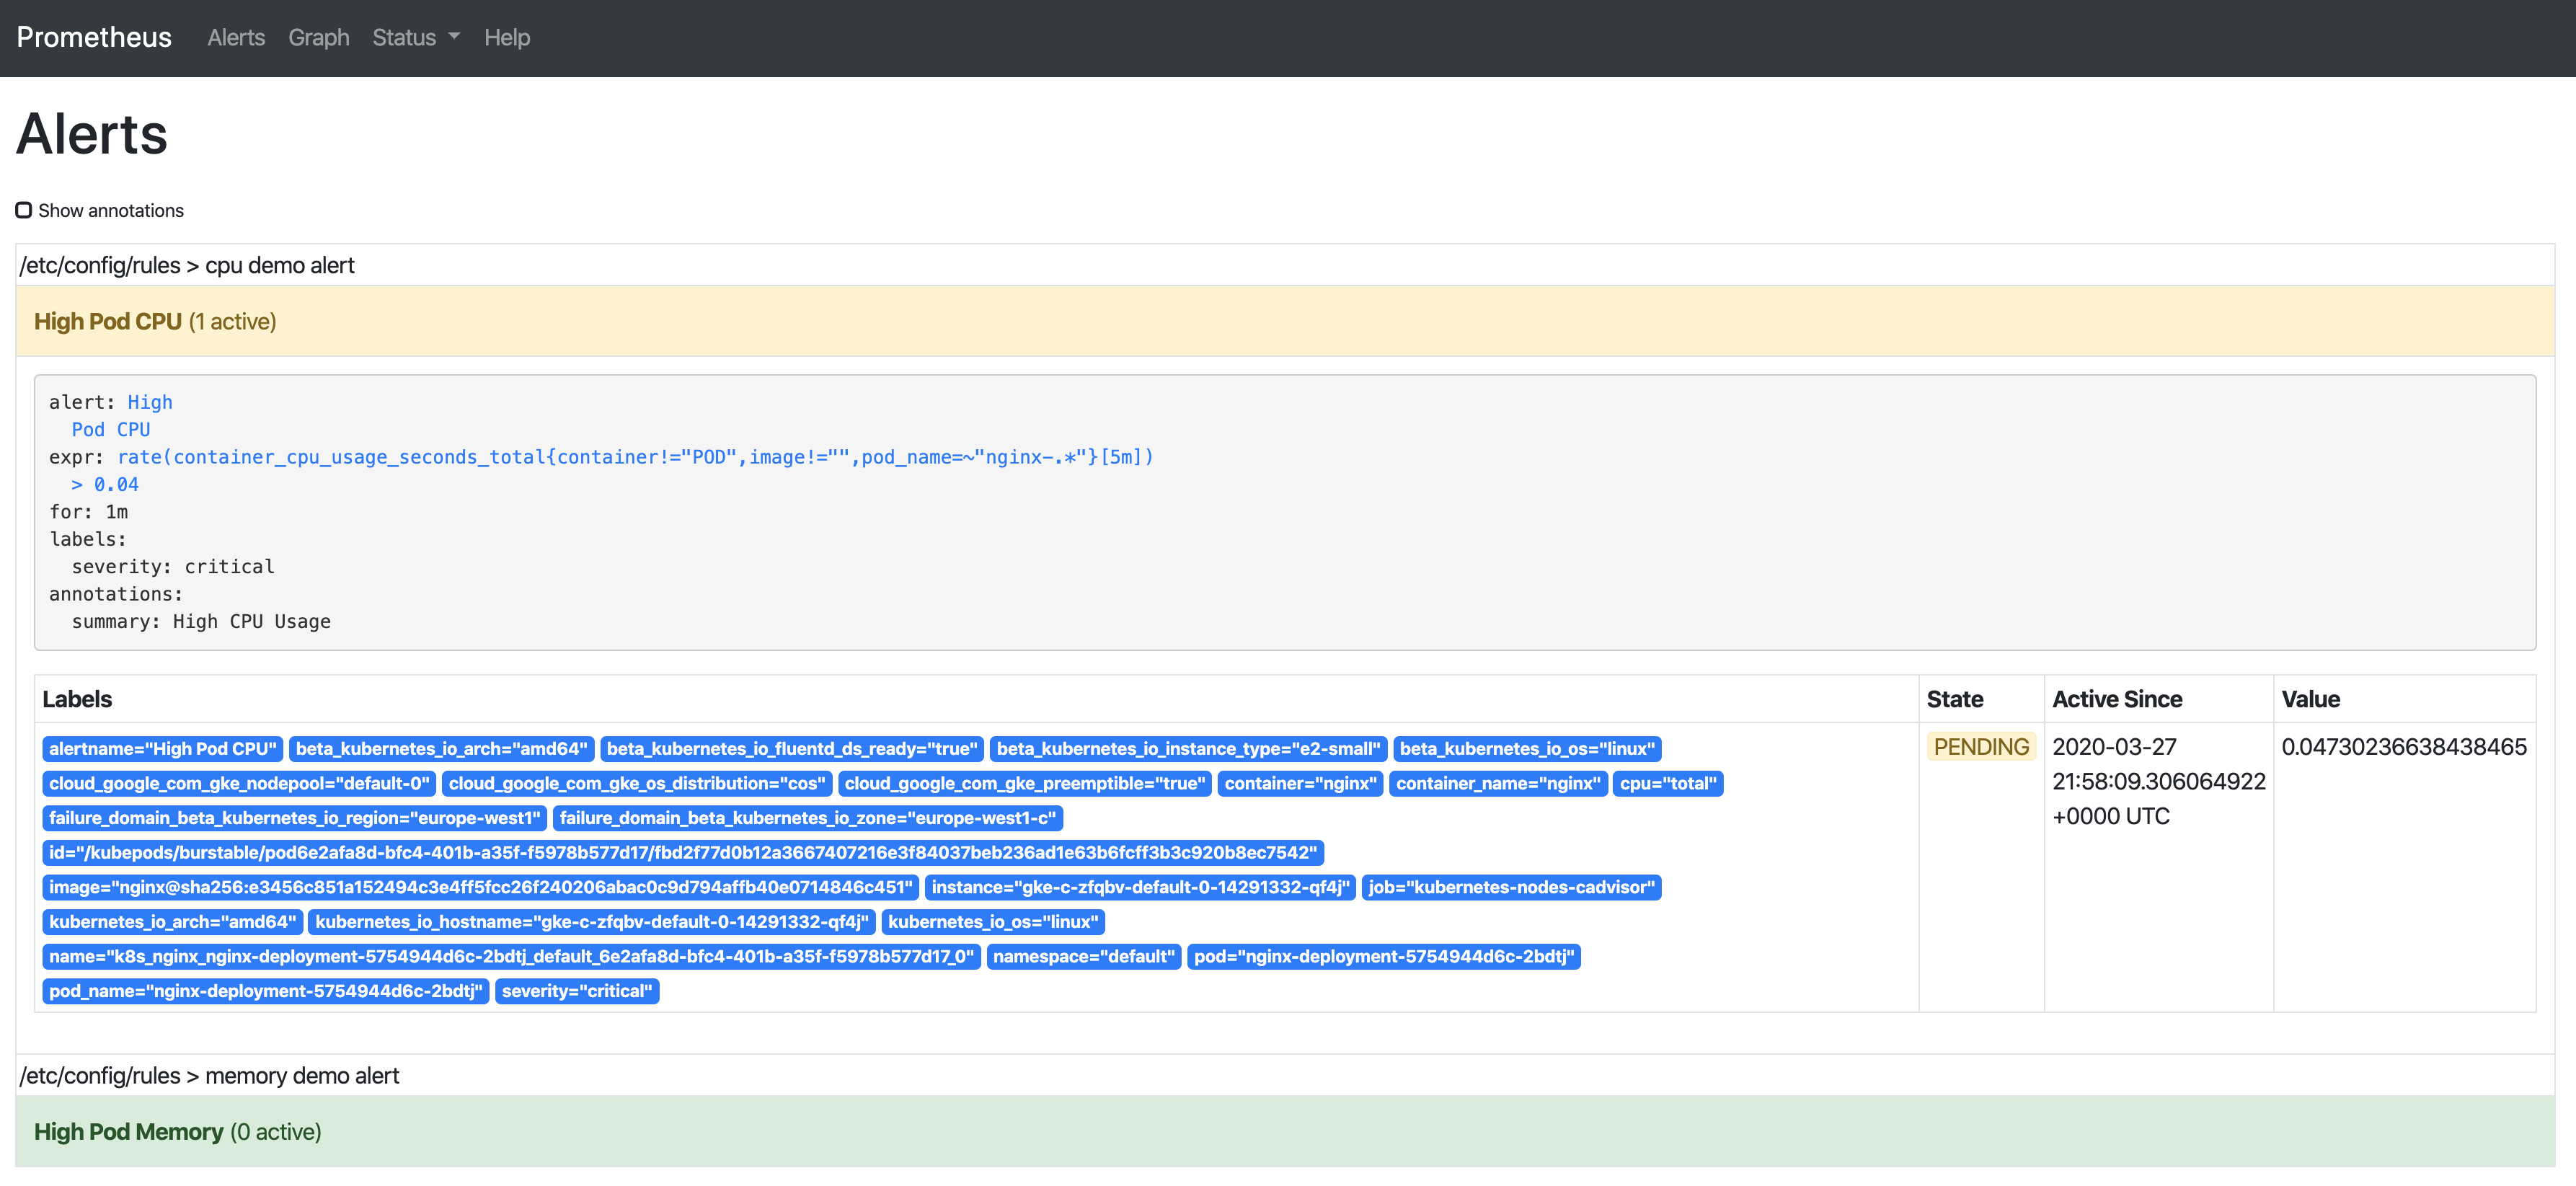
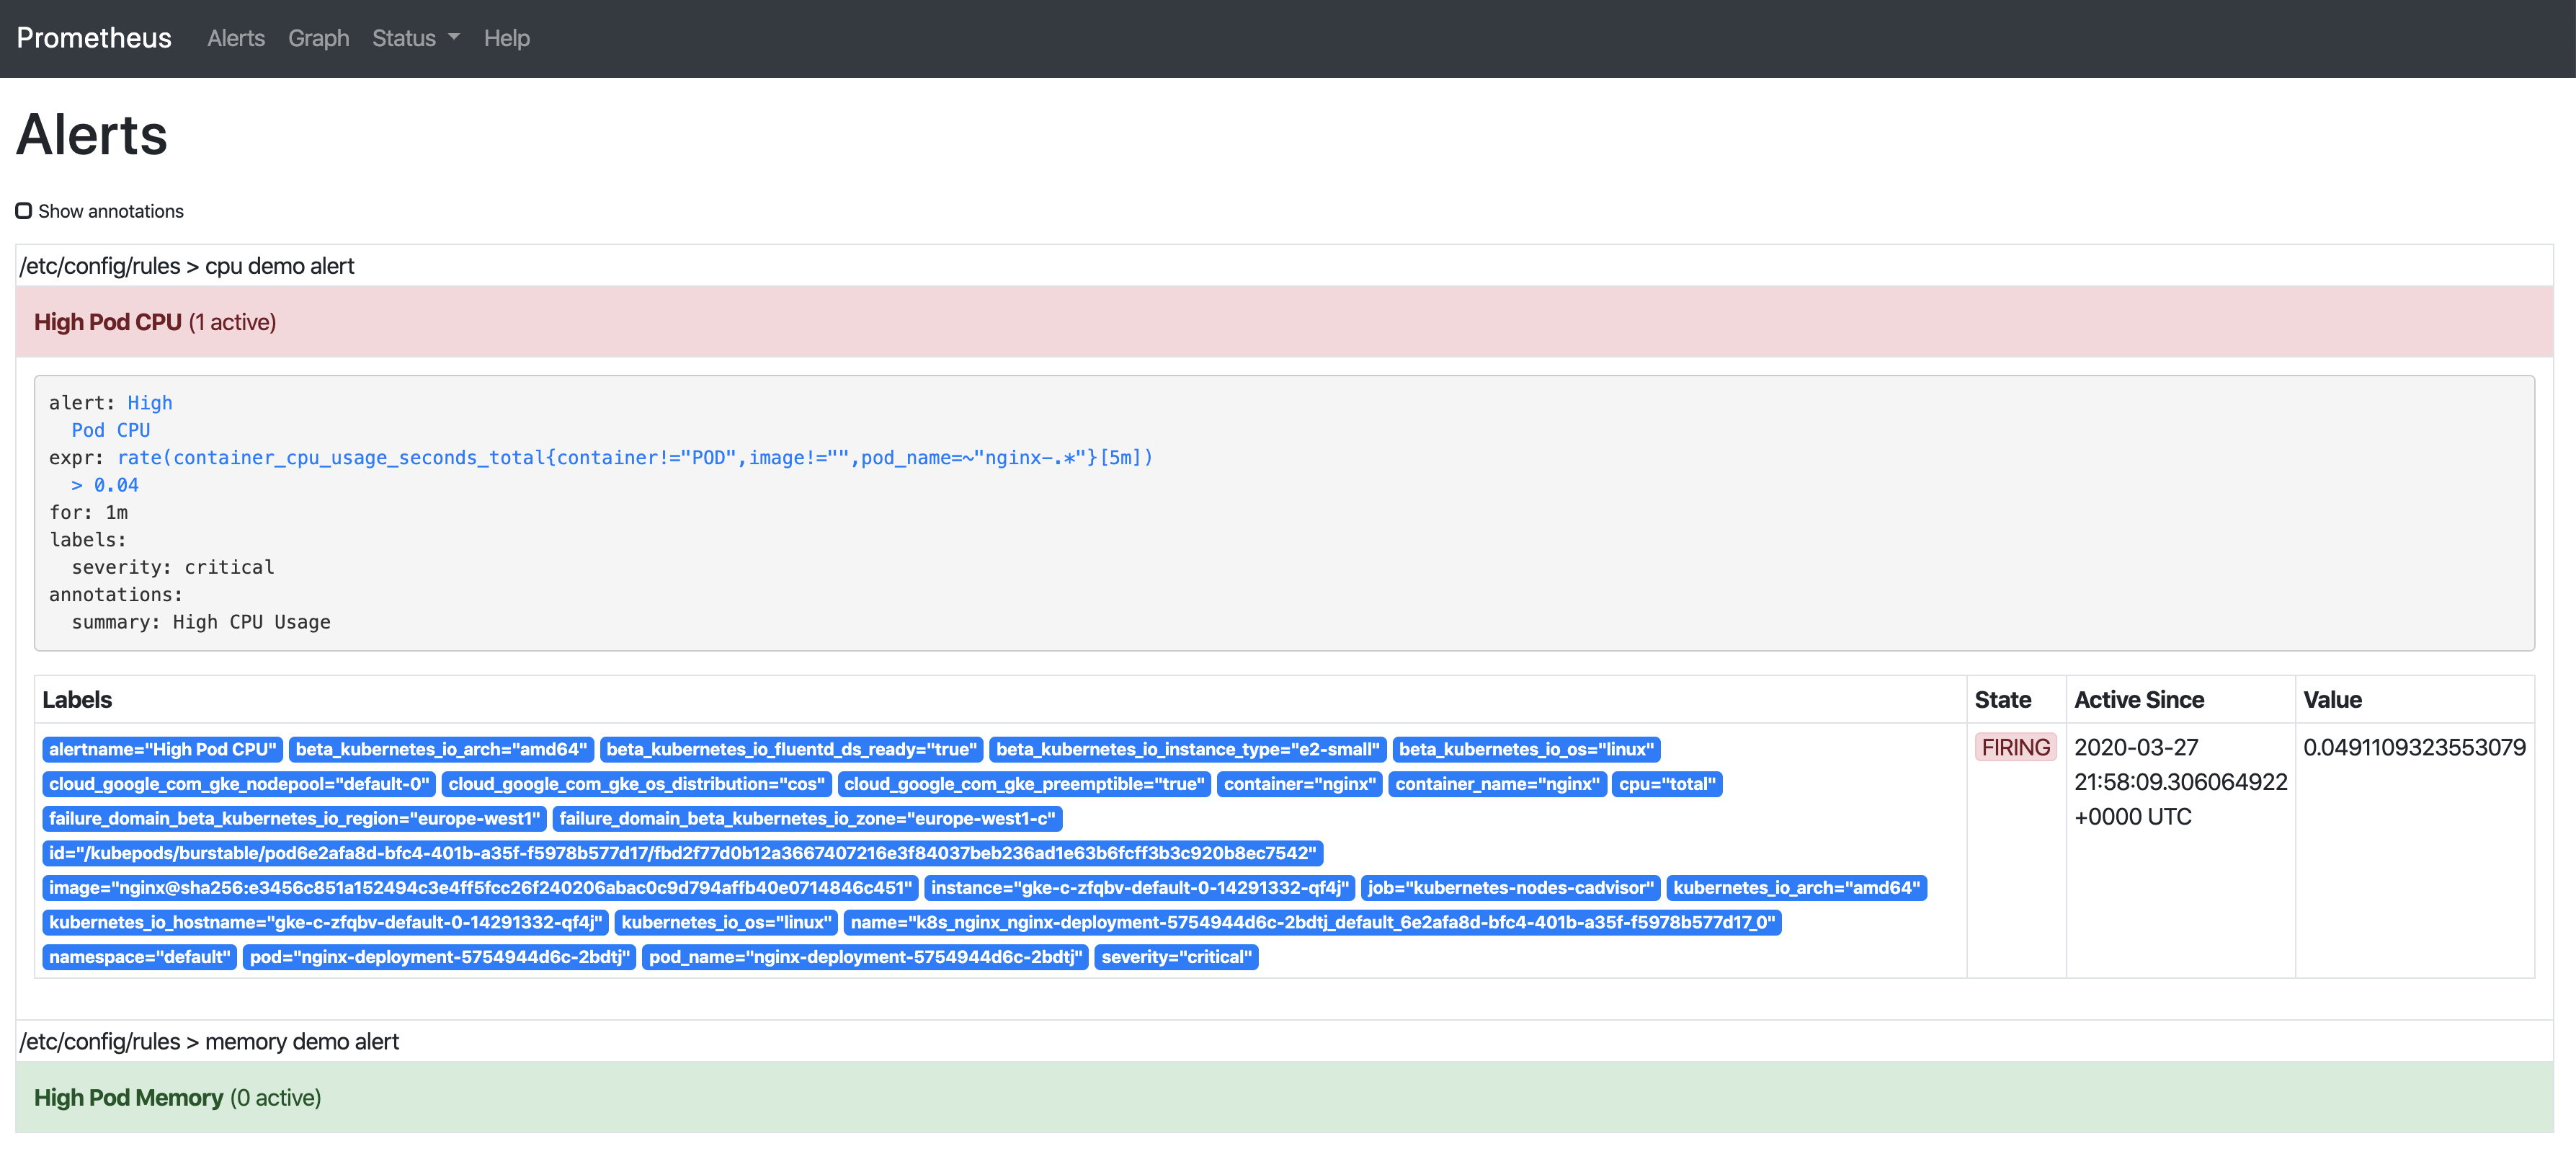
The alert has three phases:
- Inactive – condition is not met.
- Pending – condition is met.
- Firing – alert is fired.
We already saw the alert in inactive state, so putting some load on the CPU will let us observe the rest of them, too:
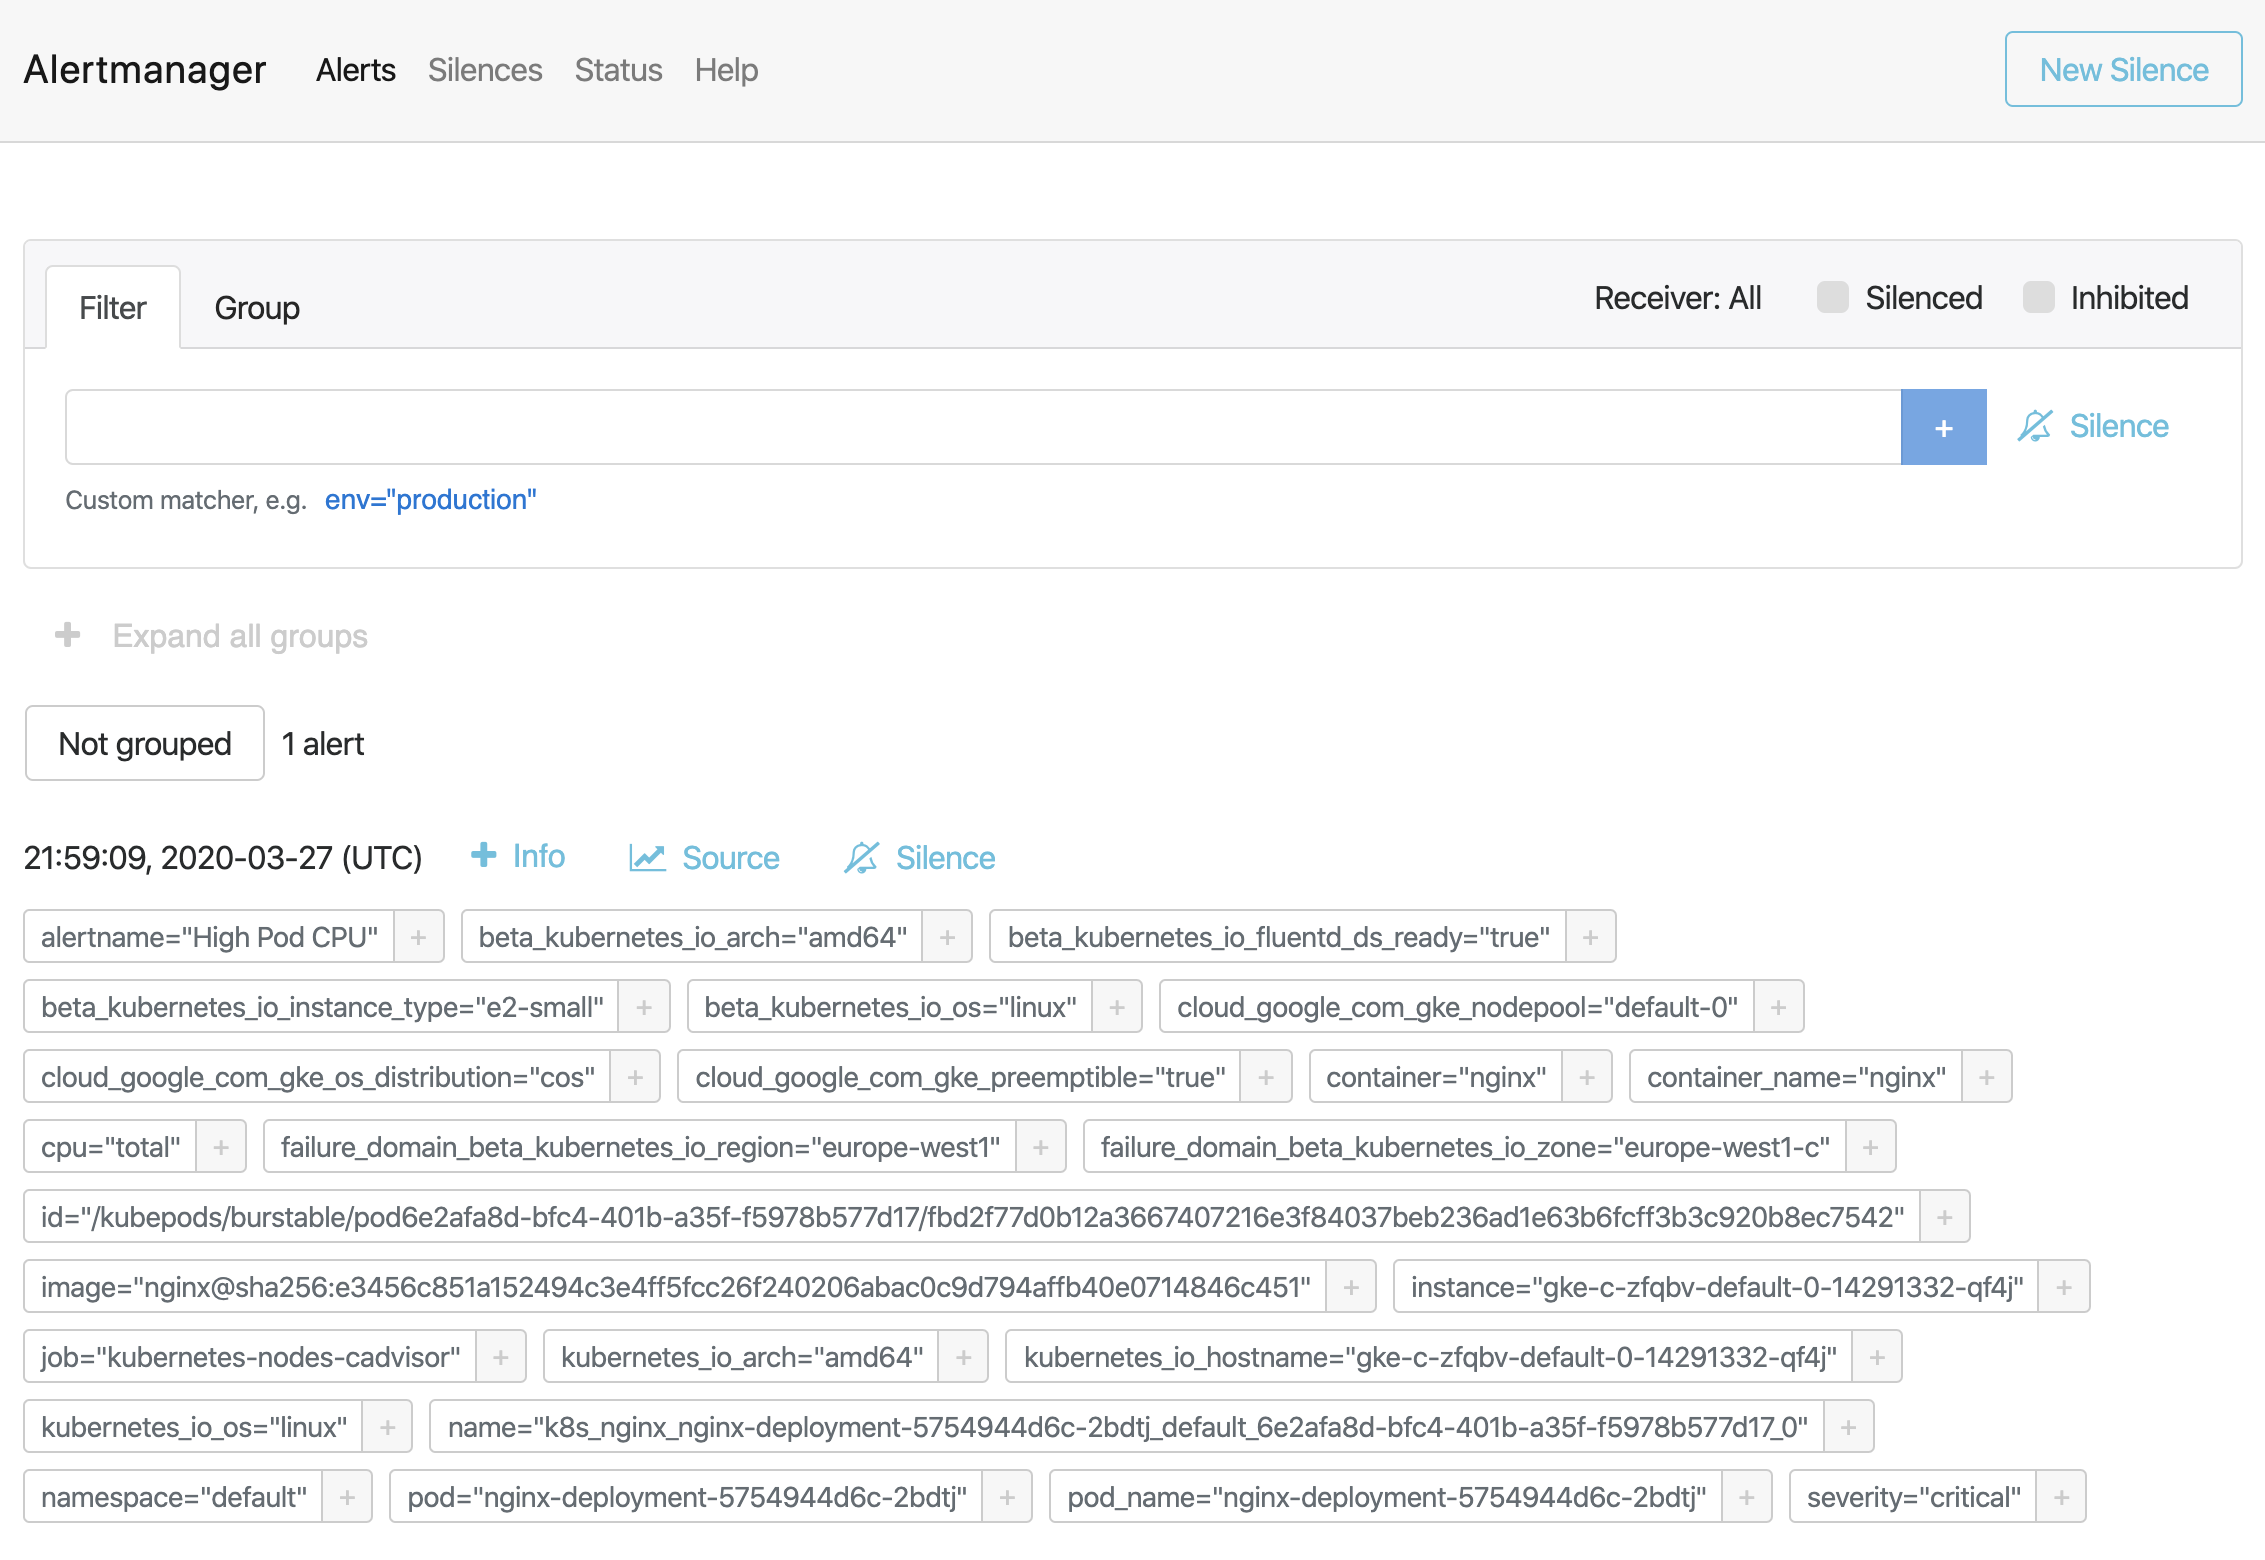
As soon as the alert is fired, this will be present in Alertmanager:
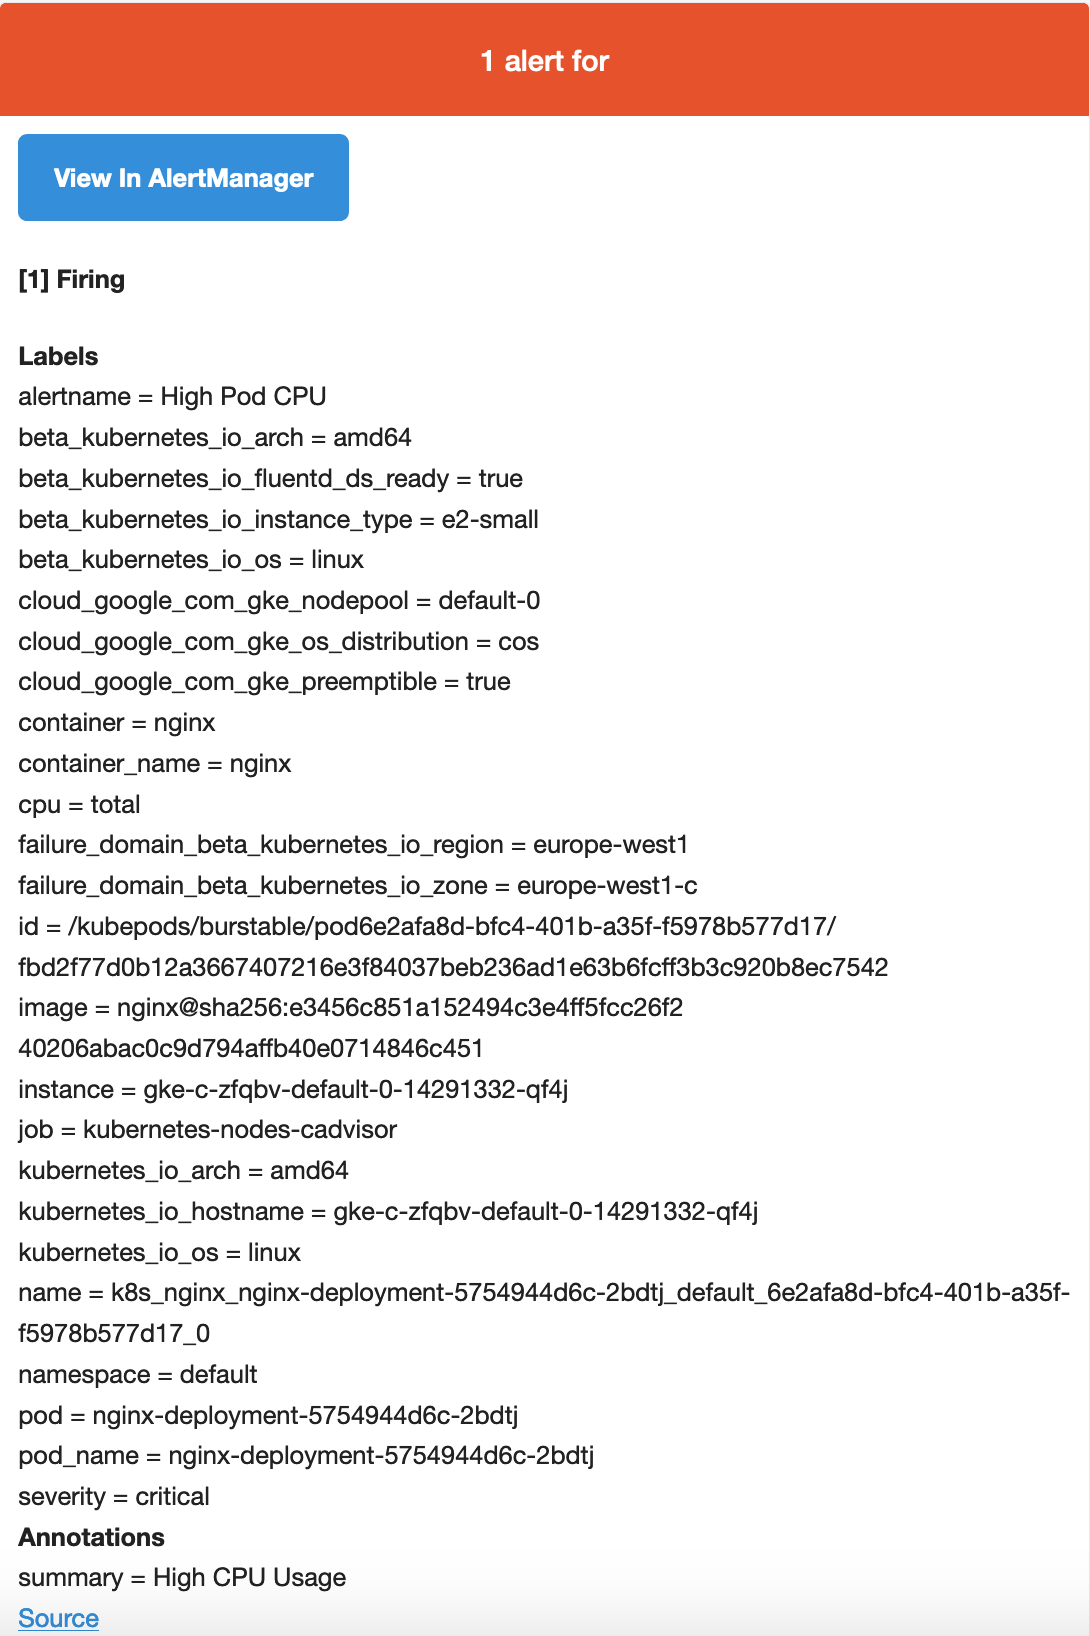
Alertmanager is configured to send emails when we receive alerts. If we check our inbox, we’ll see something like this:
Conclusion
We know how important monitoring is, but it would not be complete without alerting. Alerts can notify us as soon as a problem occurs, letting us know immediately when something goes wrong with our system. Prometheus covers both of these aspects – monitoring the solution and alerting via its Alertmanager component. We saw how easy is to use Rancher to deploy Prometheus and have Prometheus Server integrated with Alertmanager. Using Rancher, we configured alerting rules and pushed a configuration for Alertmanager so it can notify us when something happens. Finally, we saw how based on the definition/integration of Alertmanager we received an email with details of the triggered alert (this can also be sent via Slack or PagerDuty).
Want to learn more? Watch the recording of our free Master Class: Monitoring and Alerting with Prometheus & Grafana.
Related Articles
Mar 25th, 2024