Monitoring, Alerting, and Visualization for SUSE CaaS Platform
Knowledge – the Key to Management
In order to manage systems and deliver applications optimally, securely, and continuously, it’s important to know what’s going on. Are resources failing or overtaxed? Are applications serving their users well?
And while piles of statistics in reams of reports can provide the data you need, the key information in the data can be obscured by sheer volume. It’s more valuable when it’s easy to see, and when you can be alerted when limits are reached or neared or when something fails.
The gold standard for monitoring, alerting, and visualization in the cloud-native world, and for modern open source technologies in general, is the pairing of Prometheus (for monitoring and alerting) and Grafana (for visualization). That is why we’re pleased to announce that, as of the beginning of this year, they have been available in our registry as supported components of SUSE CaaS Platform.
What is Prometheus?
(Thanks to prometheus.io for information in this section.)
Prometheus is an open-source systems monitoring and alerting toolkit originally built at SoundCloud.
Prometheus’s main features are:
- a multi-dimensional data model with time series data identified by metric name and key/value pairs
- PromQL, a flexible query language to leverage this dimensionality
- no reliance on distributed storage; single server nodes are autonomous
- time series collection happens via a pull model over HTTP
- pushing time series is supported via an intermediary gateway
- targets are discovered via service discovery or static configuration
- multiple modes of graphing and dashboarding support
Prometheus scrapes metrics from instrumented jobs, either directly or via an intermediary push gateway for short-lived jobs. It stores all scraped samples locally and runs rules over this data to either aggregate and record new time series from existing data or generate alerts. Grafana or other API consumers can be used to visualize the collected data.
Prometheus can be used with data collectors, called exporters, from which the Prometheus server collects series of metrics and stores them. We provide exporters out of the box for the system, for Kubernetes, and for other components of SUSE CaaS Platform. There are dozens, if not more, exporters available for hardware, infrastructure software, utilities, and applications. And there are libraries that can be used to instrument your own applications to make their own metrics available to Prometheus.
Alerting with Prometheus is separated into two parts. Alerting rules in Prometheus servers send alerts to an Alertmanager. The Alertmanager then manages those alerts, including silencing, inhibition, aggregation and sending out notifications via methods such as email, on-call notification systems, and chat platforms.
What is Grafana?
(Thanks to the Grafana open source project.)
Grafana allows you to query, visualize, alert on and understand your metrics. You can create, explore, and share dashboards:
- Visualize: Fast and flexible client side graphs with a multitude of options. Panel plugins for many different way to visualize metrics and logs.
- Dynamic Dashboards: Create dynamic & reusable dashboards with template variables that appear as dropdowns at the top of the dashboard.
- Explore Metrics: Explore your data through ad-hoc queries and dynamic drilldown. Split view and compare different time ranges, queries and data sources side by side.
- Explore Logs: Experience the magic of switching from metrics to logs with preserved label filters. Quickly search through all your logs or streaming them live.
- Alerting: Visually define alert rules for your most important metrics. Grafana will continuously evaluate and send notifications to systems like Slack, PagerDuty, VictorOps, OpsGenie, etc.
- Mixed Data Sources: Mix different data sources in the same graph! You can specify a data source on a per-query basis. This works for even custom datasources.
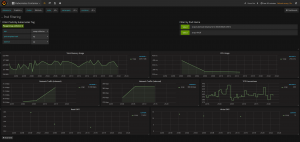
Here are some basic views of Kubernetes metrics – first, a top level dashboard:

Next, a per-pod view:
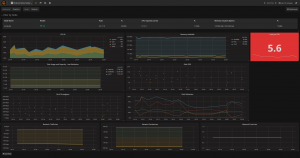
And a per-node view:
You can find some great videos about Grafana’s features here. There is also a rich library of freely available ready-made dashboards at their website. We make a set of basic dashboards for use with SUSE CaaS Platform available, along with instructions for deploying them, here.
Metrics and Visualization the Easy Way
Another way to get started is to use the Stratos UI for SUSE CaaS Platform, which is now in tech preview. The Stratos Metrics chart installs a pre-configured version of Prometheus, ready to deliver metrics for SUSE CaaS Platform. (And for SUSE Cloud Application Platform too!)
The Big Picture
Prometheus and Grafana are the monitoring, alerting, and visualization solution that will be used for all SUSE offerings in the future. In addition to our application delivery offerings, you will see it delivered with SUSE Enterprise Storage, SUSE Manager, and others.
With this highly scalable, extensible open source solution, you will find it intuitive and easy to make the decisions and take the actions that keep your business-critical resources and applications online and bringing key value to your business.
Related Articles
Jan 12th, 2023
SUSE Receives 15 Badges in the Winter G2 Report
Oct 25th, 2022
An AWS Webinar Double Header In November
Jun 06th, 2022
Comments
Grafana’s screenshot is from Minikube cluster, not SUSE CaaS Platform.
Correct. It’s from Grafana Labs’ website. I didn’t have access to a SUSE CaaS Platform cluster when I wrote it. As soon as I do, I will update screenshots.